Building Game Analysis Content Quickly with Templates
Analyzing game data means deciding on metrics, dimensions, and event steps that fit your purpose each time, and the earlier you are in an analysis, the more time this setup takes. Hive Analytics templates provide ready-made dashboard, chart, funnel, and retention setups you often use, cutting down this initial setup work. Selecting a template from the Create menu takes you to a setup screen with the key fields already filled in, which you can use as is or adjust to fit your analysis purpose.
Content You'd Otherwise Build From Scratch
Analyzing game data means configuring metrics, dimensions, and event steps to match what you want to check. To view several metrics on one screen, or to check a user's conversion and drop-off flow, you also need to decide which data to place together and by what criteria to show it.
A first-time analysis takes time to choose and configure the right items. Referring to a template that fits your analysis purpose lets you cut down initial setup time by adjusting only the data and detailed conditions you need, so you can start even an unfamiliar analysis quickly. Repeated analyses also become more efficient, since you don't have to rebuild the same structure each time.
Templates in Hive Analytics
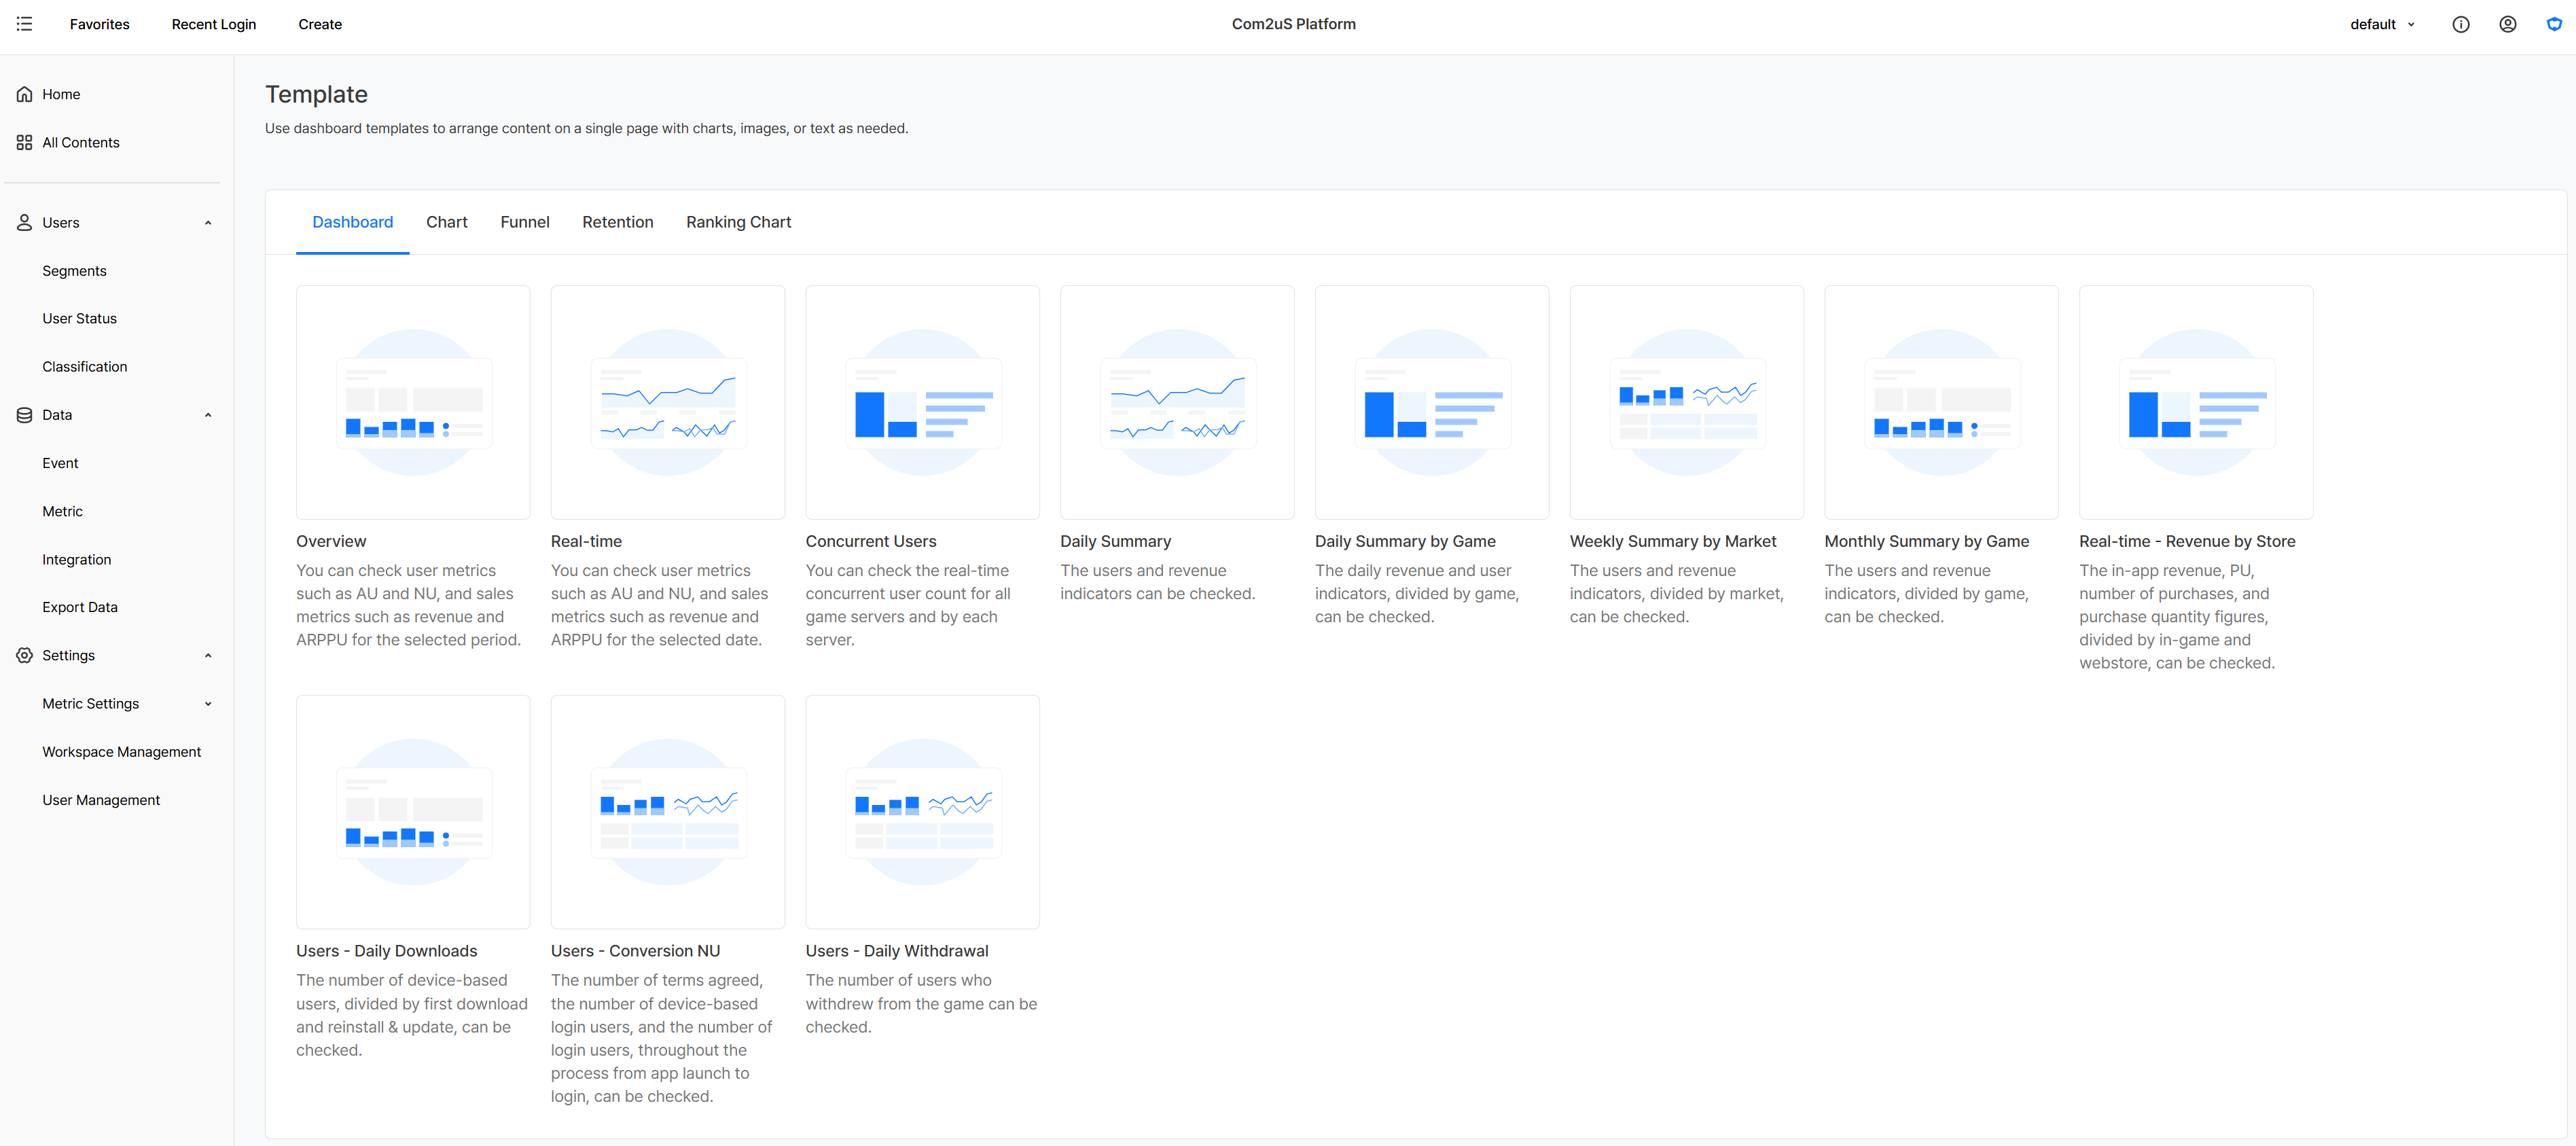
Hive Analytics templates provide ready-made dashboard, chart, funnel, and retention setups you often use. Selecting a template from the Create menu and picking the setup you want takes you to a setup screen with the key fields already filled in.
A template provides an initial setup for creating content, and after applying it you can adjust every field to fit your analysis purpose. In a dashboard template, you can choose a project for each pre-arranged panel, and add or remove content, image, and text panels. In chart, funnel, and retention templates, you can change the measures, dimensions, events, and analysis conditions based on the provided setup.
Getting Started With the Analysis You Need, Using Templates
Let's look at how to create content by applying a template as is, and how to adjust the provided setup to fit your analysis purpose.
Creating Content With a Template As Is
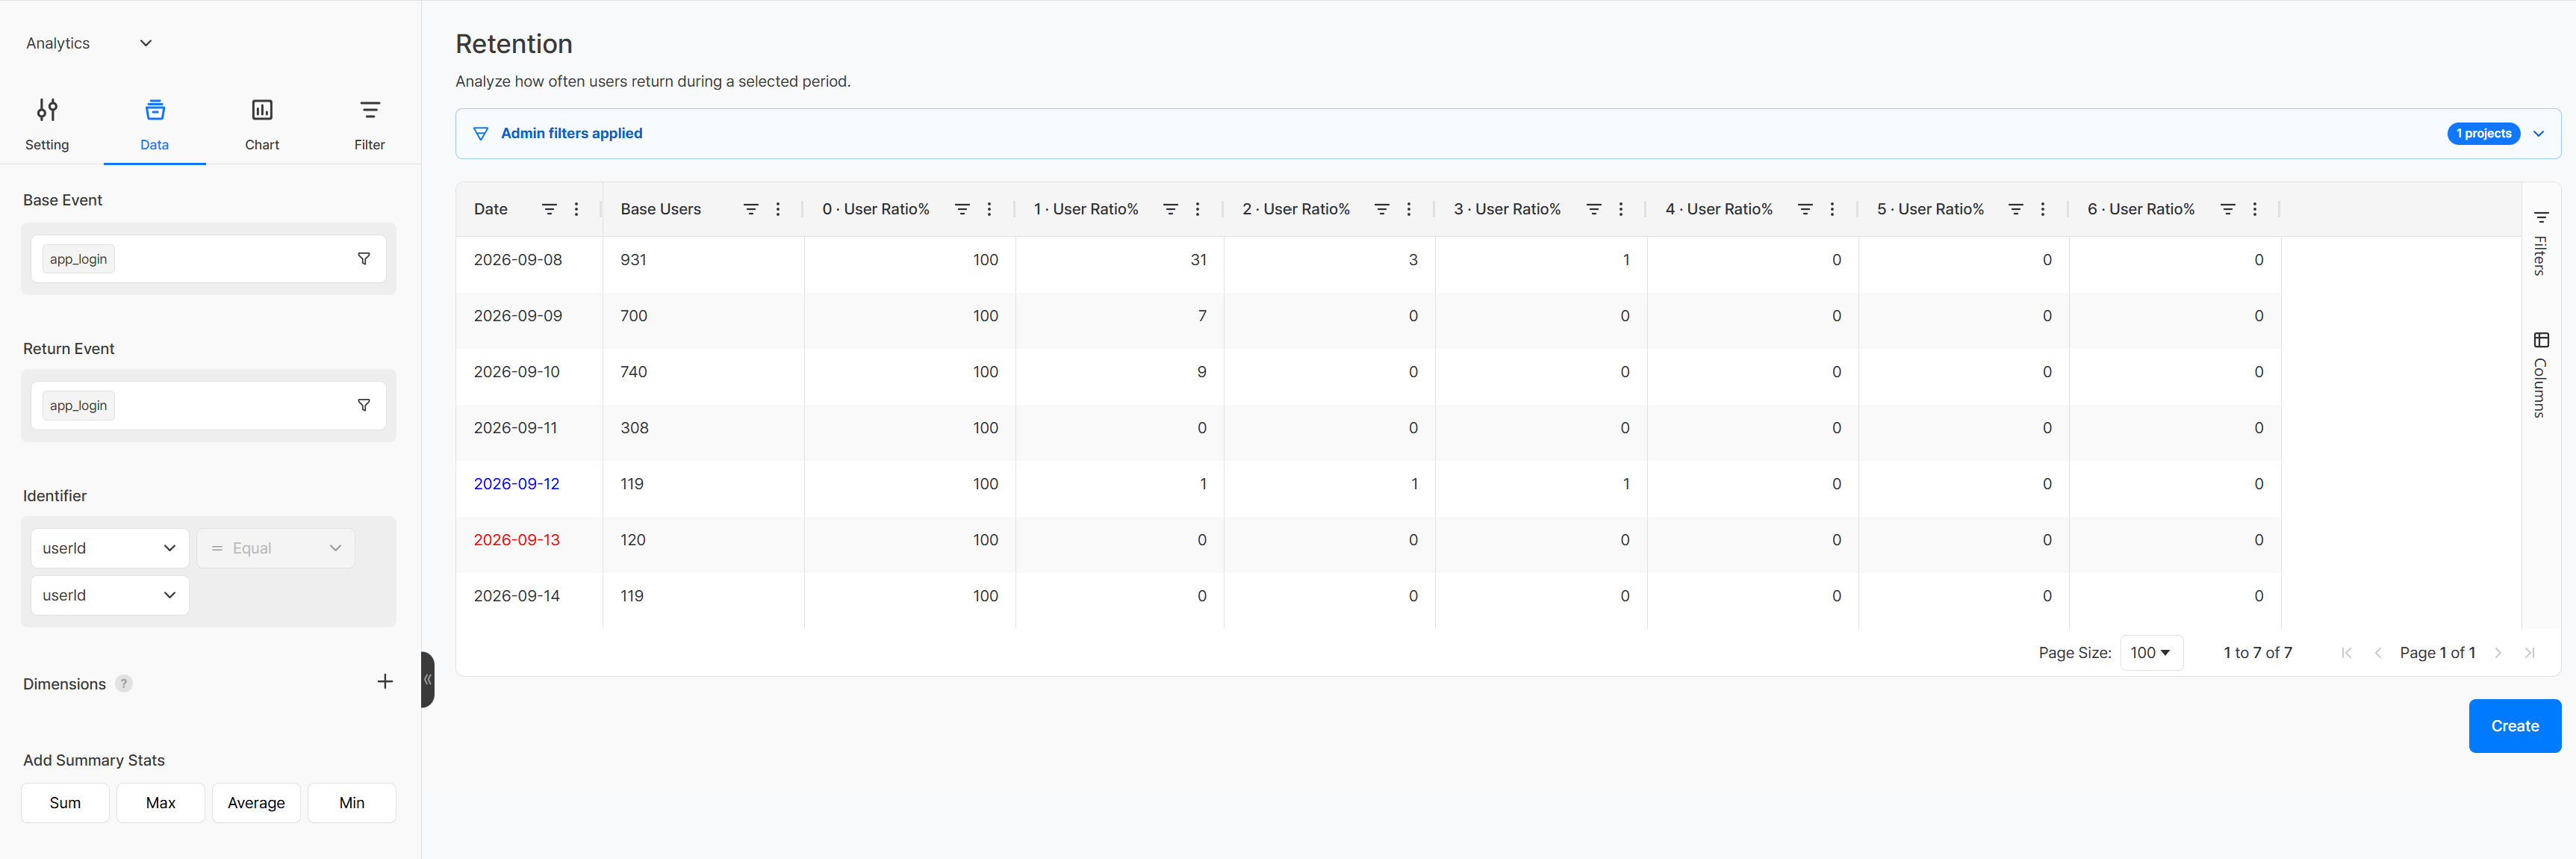
Selecting a template takes you to a setup screen with the key fields already filled in. To use the provided setup as is, check the result in the preview, then click the create button and save the content under the name you want. The screen below is an example of applying the Active Users (AU) retention template: the login event is set as both the base event and the return event, letting you check the base user count by date and the return rate.
Adjusting a Template to Create Content
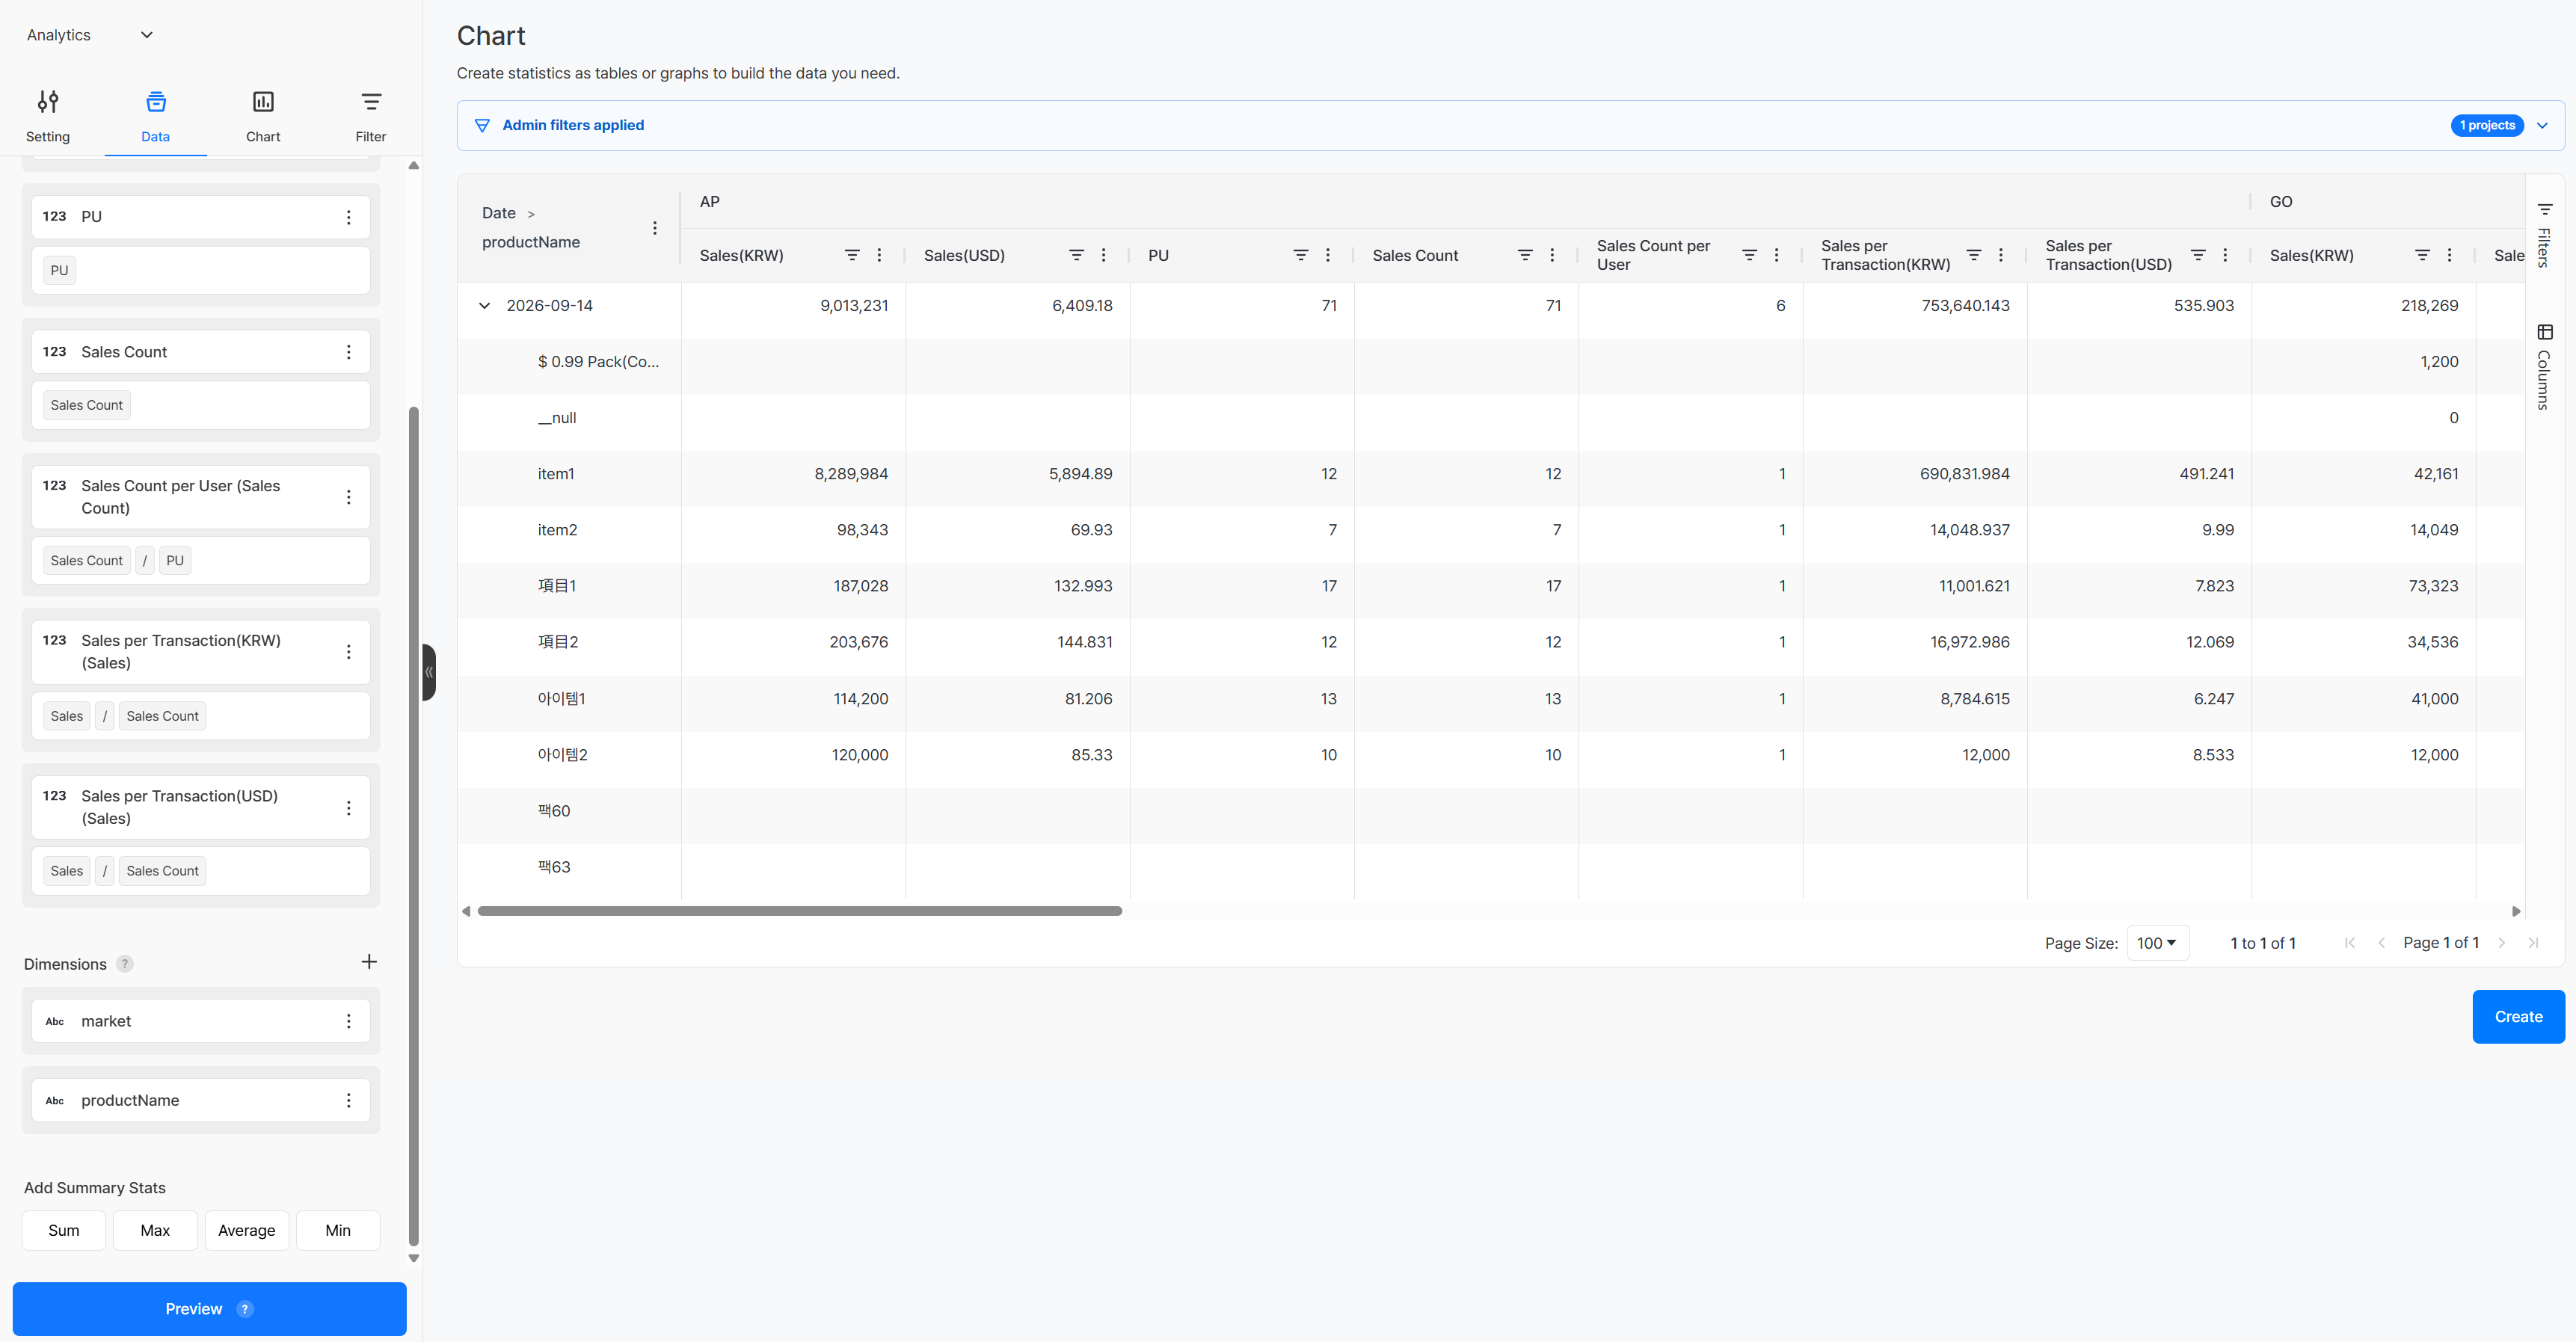
On a template's setup screen, you can adjust the provided measures, dimensions, and other settings to fit your analysis purpose. The screen below is an example of applying the sales-by-country chart template, which is set up with measures such as Paying Users (PU), revenue, and number of sales, along with country and product name dimensions.
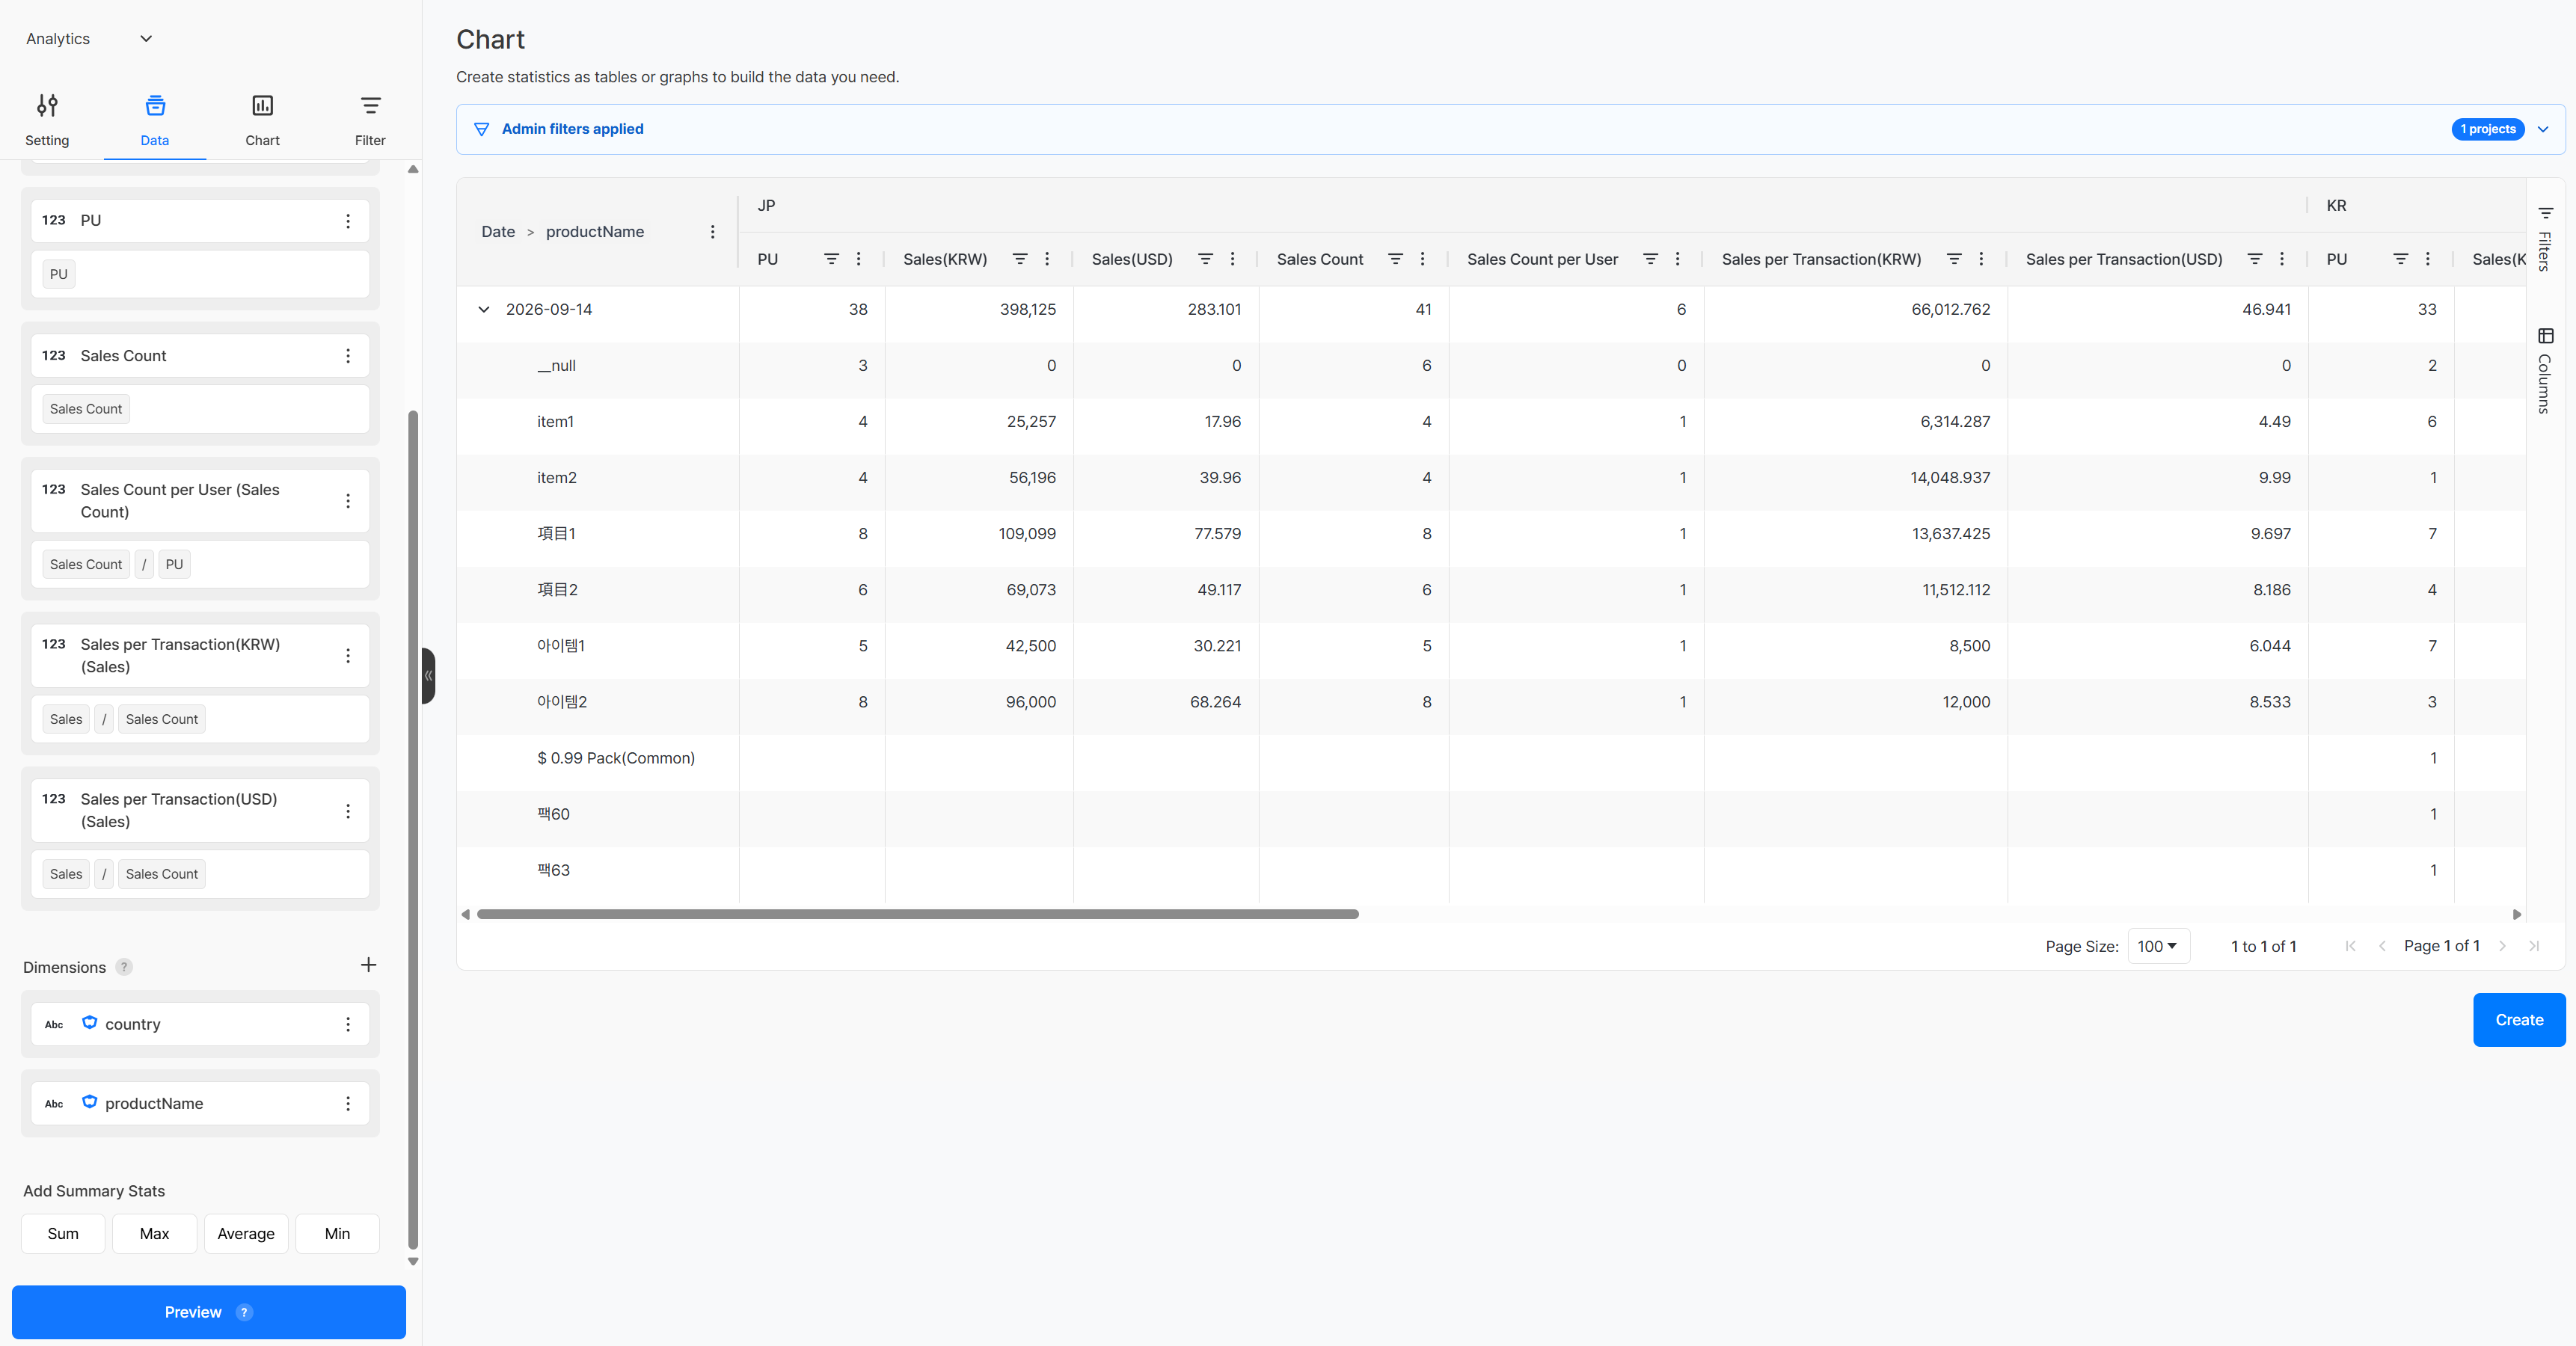
To check product performance by market, change the country dimension to a market dimension. Switch to a chart that shows sales by market while keeping the existing measures and product name dimension, check the result in the preview, then save it as a new chart.
Get Started With Hive Analytics
With templates, you can quickly load a basic setup for analysis content and adjust only what you need to start analyzing your game data.
Hive Analytics is a game-focused analytics solution that applies game data collected through the Hive SDK to ready-made templates, letting you quickly build and analyze the content you need. Useful templates that let you look at game data from various angles will keep being added. Start building the game analysis content you need now with Hive Analytics templates.