Querying Game Metrics and Checking Changes in Natural Language: Using Hive Axyl Plugin, Part 1
With Hive Axyl Plugin installed in ChatGPT, you can query Hive Analytics metrics in natural language and narrow the scope of analysis by country, market, and product while carrying over the context of earlier questions. To use it, an Analytics administrator must register projects and members in an organization, and the account that will use the plugin must be set as an MCP member of the organization. The results show where changes are concentrated and which factors may be responsible, while high-value orders, prices, and promotion changes for the affected products still need to be checked separately.
Natural Language Analysis That Reduces Repetitive Setup
To analyze game metrics, you first need to decide which metrics, period, comparison baseline, dimensions, and filters to use. Even with a simple question such as “Why did revenue drop yesterday?”, the analysis screen requires you to select revenue and paying-user metrics, compare them with the same day last week, and then apply conditions such as country and market one by one.
Generative AI lets you express this analysis goal in natural language. Missing conditions can be settled through conversation, and based on the first result you can request country- and market-level comparisons or product-level analysis in succession. Because the context of earlier questions is kept, you no longer have to explain the analysis conditions from scratch or rebuild them on the screen each time.
When it is unclear which metrics to look at next, you can also ask for recommendations on the next analysis criteria based on the current result. Natural language analysis helps turn business questions into concrete analysis conditions and quickly expand from earlier results to new perspectives.
Natural Language Data Analysis in Hive Analytics
With Hive Axyl Plugin installed in ChatGPT, you can query and analyze Hive Analytics metrics in natural language. Request the metrics and period you want to check in a sentence, then add dimensions such as country, market, and app to examine the conditions that affected the change.
The analytics features of Hive Axyl Plugin can be used regardless of the SDK version applied to the game. In projects using either Hive SDK v4 or Hive Axyl, you can analyze the analytics data within the permissions granted to your organization and account.
- Install the plugin: Find Hive Axyl Plugin in the ChatGPT plugin list, install it, and start a new chat.
- Set up the organization: An Analytics administrator registers the projects and members to use in the organization under
Account > Organization Management. - Set MCP permissions: Set the account that will use the plugin as an MCP member of the organization.
- Start analyzing: Connect your Hive account in ChatGPT and confirm the organization, project, and production or sandbox environment to use.
Project access by organization
An account registered as an MCP member can only query data from projects connected to that organization.
For how to install Hive Axyl Plugin and examples of using it for analytics, see Install Hive Axyl Plugin and Introduction to Hive Axyl AI.
Analyzing KPI Changes and Their Causes
For example, suppose you want to check how yesterday’s user and revenue metrics differed from the same day last week. If you check the overall change with the first question and then continue asking about country, market, and product in that order, you can narrow down the scope of the revenue decline step by step.
First question: How much did the user and revenue metrics change?
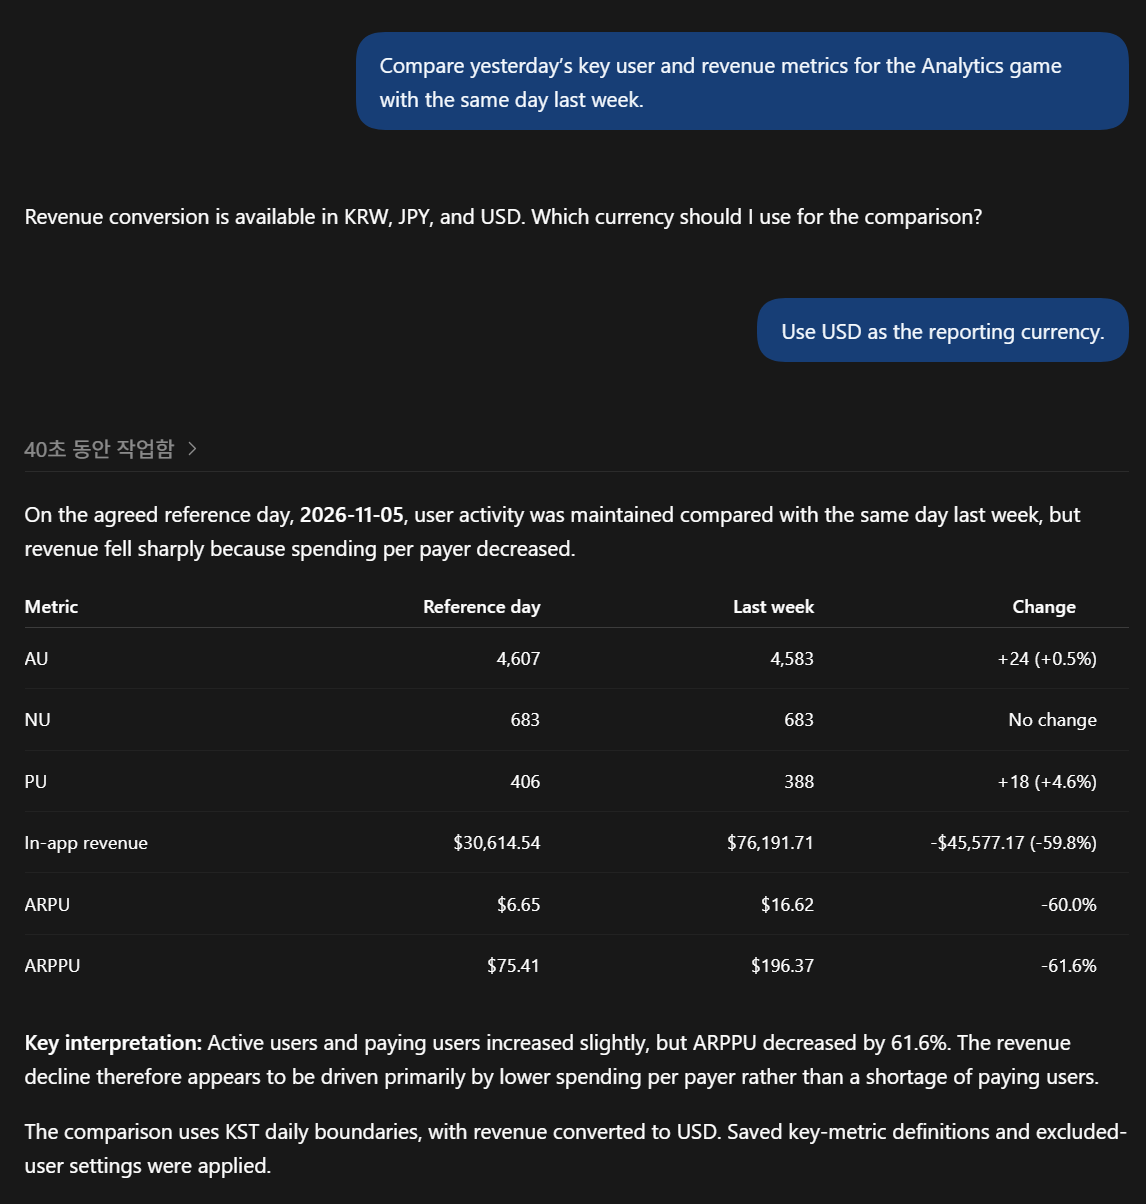
Compare yesterday’s key user and revenue metrics for the Analytics game with the same day last week.
If multiple revenue conversion currencies are configured, first choose the currency to use for the comparison. When USD is specified as the reference, you can compare active users (AU), new users (NU), paying users (PU), in-app revenue, average revenue per user (ARPU), and average revenue per paying user (ARPPU) for yesterday and the same day last week on the same basis.
The following result showed that active users and paying users changed little, while revenue and ARPPU dropped sharply. This supports the hypothesis that the revenue decline is related more to a change in spending per payer than to the number of paying users.
Second question: Which countries and markets showed the largest ARPPU decreases?
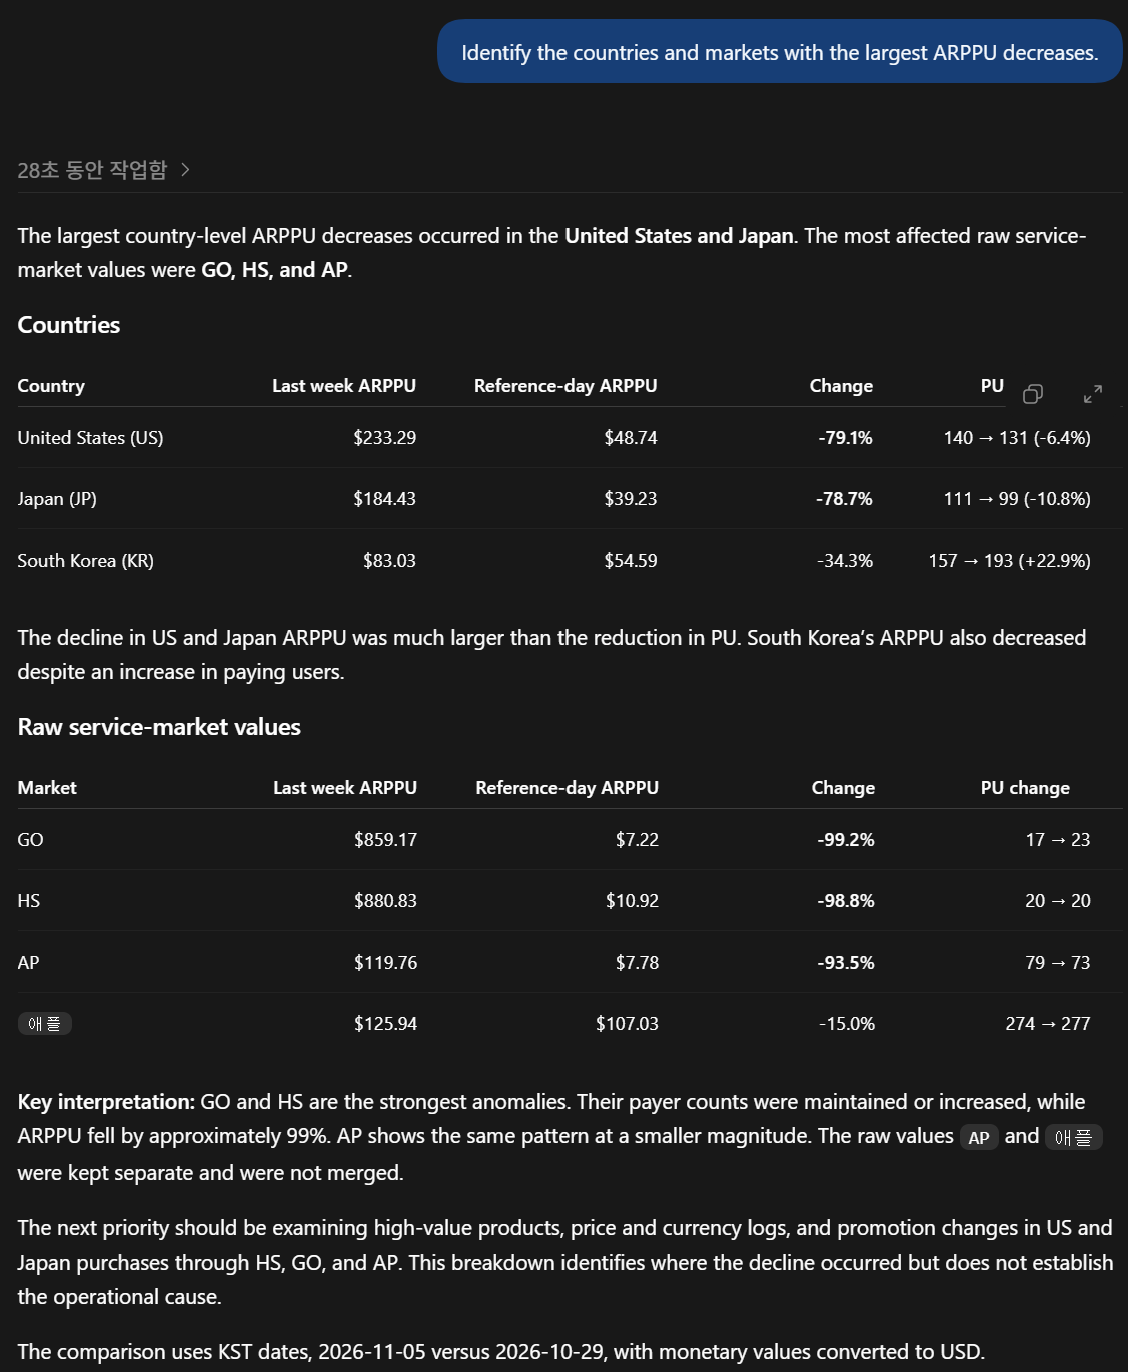
Identify the countries and markets with the largest ARPPU decreases.
Comparing ARPPU and PU changes by country and market together reveals segments where the decrease in spending per payer was larger than the change in the number of paying users. In the following result, the United States and Japan showed the largest ARPPU drops, and by market, HS, GO, and AP were the first to check.
If market values are collected under different notations, examine the raw values separately instead of combining them arbitrarily. Based on this result, the next question checks product sales in the countries and markets with the largest decreases.
Third question: Which products contributed most to the ARPPU decrease?
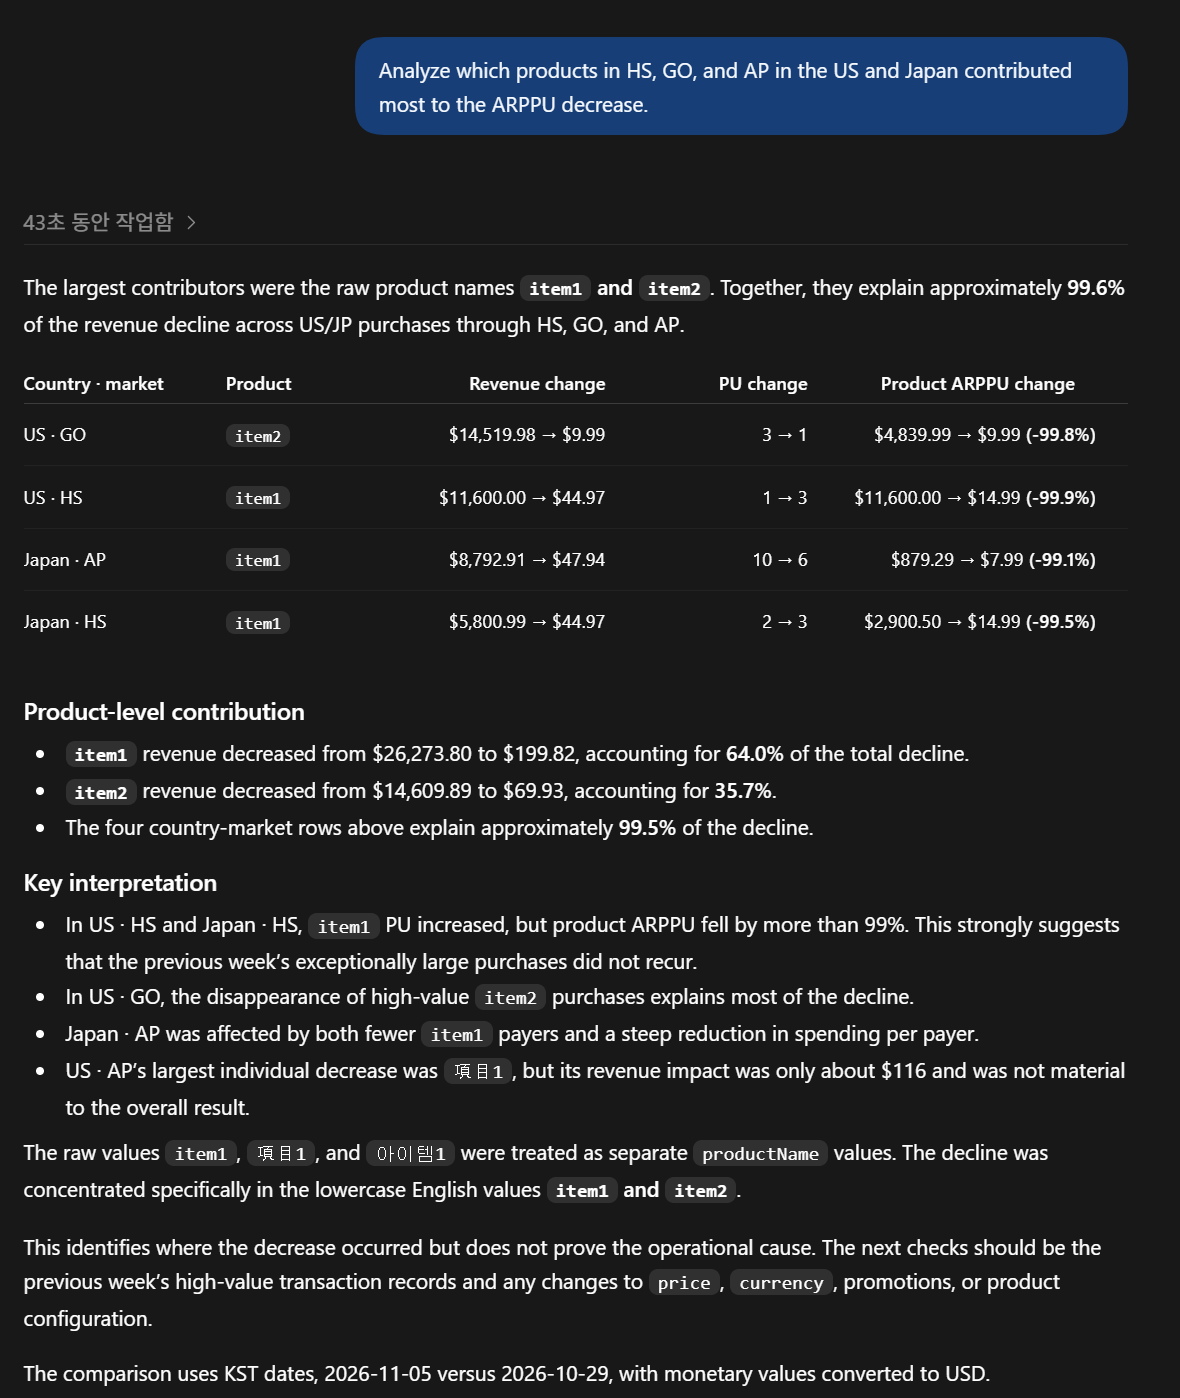
Analyze which products in HS, GO, and AP in the US and Japan contributed most to the ARPPU decrease.
Comparing revenue, PU, and product ARPPU by product for the countries and markets with large decreases lets you pinpoint the products that most affected the change. The following result showed that the revenue decline of item1 and item2 explained most of the decrease, and in some segments product ARPPU dropped sharply even though PU stayed the same or increased.
If the same product is collected under different raw product names, check the values separately instead of merging them arbitrarily. Based on the analysis, you can further check those products’ high-value orders, price and currency logs, and promotion changes.
By continuing with follow-up questions in natural language, you can narrow the scope of analysis step by step from overall KPI changes down to country, market, and product, and pinpoint likely causes. How to build charts and dashboards for checking these results repeatedly is covered in the next article, “Building Charts and Dashboards in Natural Language: Using Hive Axyl Plugin, Part 2.”
Get Started with Hive Analytics
With Hive Axyl Plugin, you can compare the KPIs you want to check in natural language and examine the causes of changes step by step by applying detailed dimensions.
Hive Analytics is an analytics solution built for games that lets you analyze changes in key KPIs and user behavior using events collected through the Hive SDK. Install Hive Axyl Plugin in ChatGPT now and analyze your game data in Hive Analytics in natural language.