Building Charts and Dashboards in Natural Language: Using Hive Axyl Plugin, Part 2
To recheck conditions found during analysis, you need to apply the same measures, operations, dimensions, period, and filters every time. With Hive Axyl Plugin, you can request chart configurations in natural language and combine multiple charts into a single dashboard. Before creating or editing anything, the plugin shows what it will apply and runs only after you approve, so the revenue and ARPPU decline analyzed in Part 1 can be turned into a dashboard built from five recommended metrics and checked repeatedly.
Building Dashboards Quickly from Analysis Results
In “Querying Game Metrics and Checking Changes in Natural Language: Using Hive Axyl Plugin, Part 1”, we covered how to install the plugin, compared KPIs in natural language, and applied dimensions such as country and market to look into the causes of change. In this part, we look at how to save the analysis conditions you identified as charts and combine multiple charts into a dashboard.
Even after finding meaningful metrics through analysis, checking the same content on a dashboard requires applying the same measures, operations, dimensions, period, and filters. By describing what you need in natural language, you can prepare the configuration of multiple charts and dashboards at once and review the metrics and conditions to apply before anything is created.
Creating Charts and Dashboards in Hive Analytics with Natural Language
With Hive Axyl Plugin, you can specify measures, operations, dimensions, and periods in natural language and create charts like those in Create > Chart in Hive Analytics. You can then go on to request that several of the created charts be combined into a single dashboard.
When creating or editing a chart, the plugin first shows what it will apply and runs the task only after you approve.
The analytics features can be used regardless of which SDK version is applied to the game, Hive SDK v4 or Hive Axyl. However, the Hive account connected in ChatGPT must be registered as an MCP member of the organization, and charts and dashboards can only be created within the projects connected to that organization.
- Define the analysis criteria: Decide which measures, operations, dimensions, and query period you want to check repeatedly.
- Create charts: Request a chart configuration in natural language and review the settings and results before saving.
- Build the dashboard: Select the charts to view together and arrange them on one screen to suit the purpose of the analysis.
- Refine the configuration: Add charts or conditions as needed and adjust the layout of existing content.
The plugin installation and the MCP member setup for your organization are covered in Part 1.
Building a Revenue Analysis Dashboard
In Part 1, we checked step by step the countries, markets, and products where the revenue and ARPPU decline was largest. This time, we get recommendations for metrics to keep monitoring that change and turn the recommendations into a single dashboard.
Getting metric recommendations
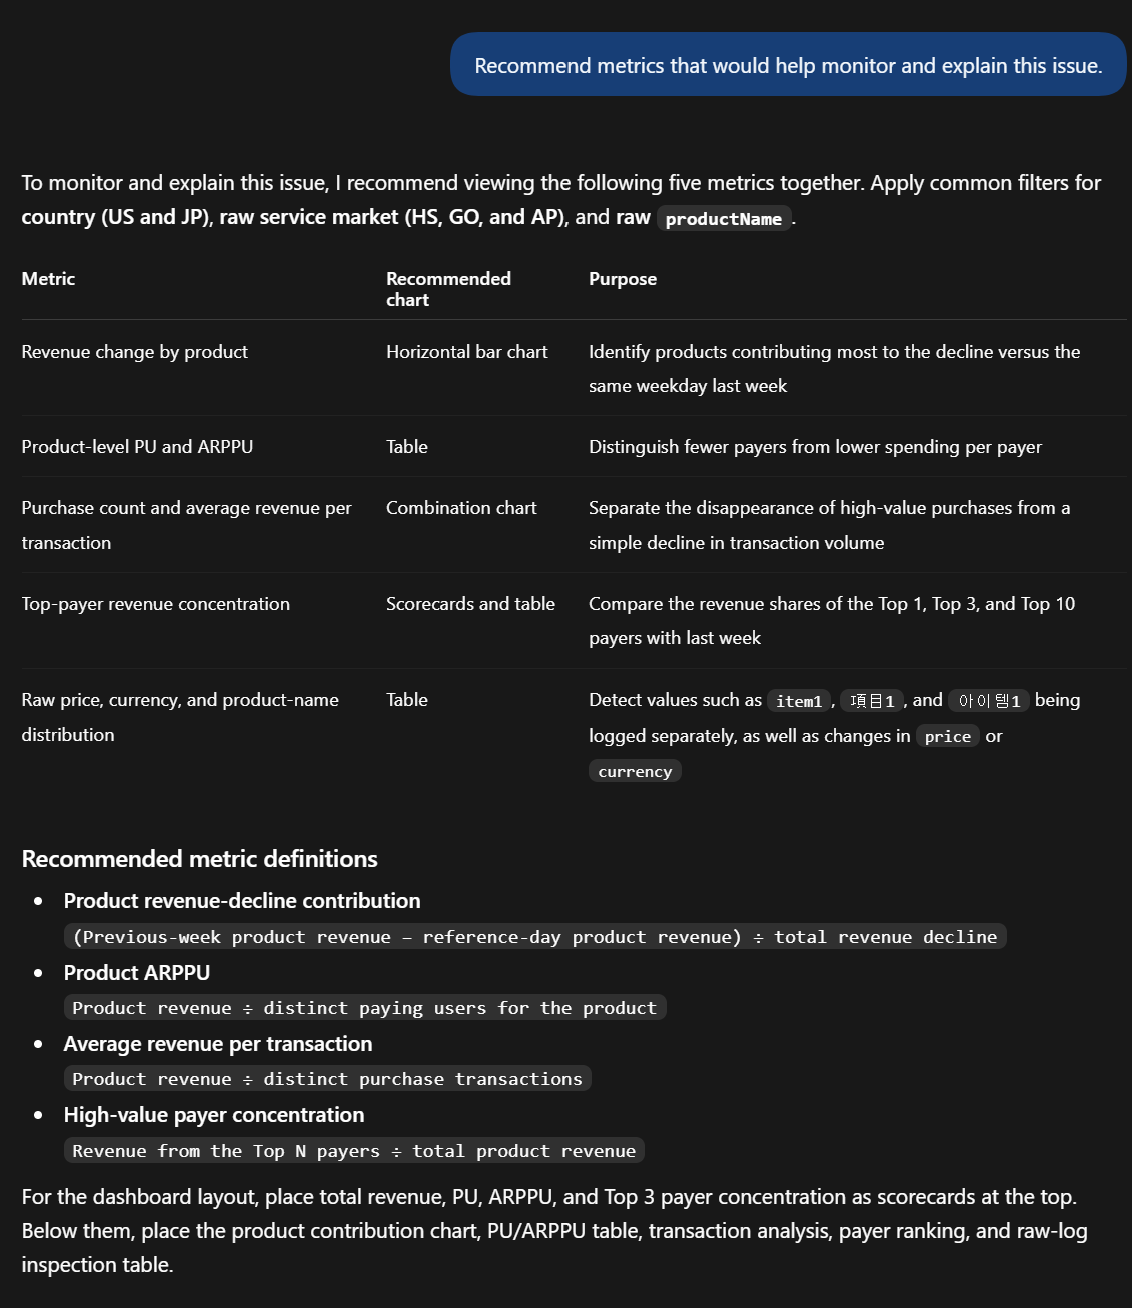
Recommend metrics that would help monitor and explain this issue.
Based on the context of the previous analysis, Hive Axyl Plugin recommends revenue change by product, PU and ARPPU by product, purchase count and average revenue per transaction by product, top-payer revenue concentration, and the distribution of raw price, currency, and product name values. Because it also presents the purpose and recommended chart type for each metric, you can flesh out the configuration your dashboard needs.
Creating a dashboard from the recommended metrics
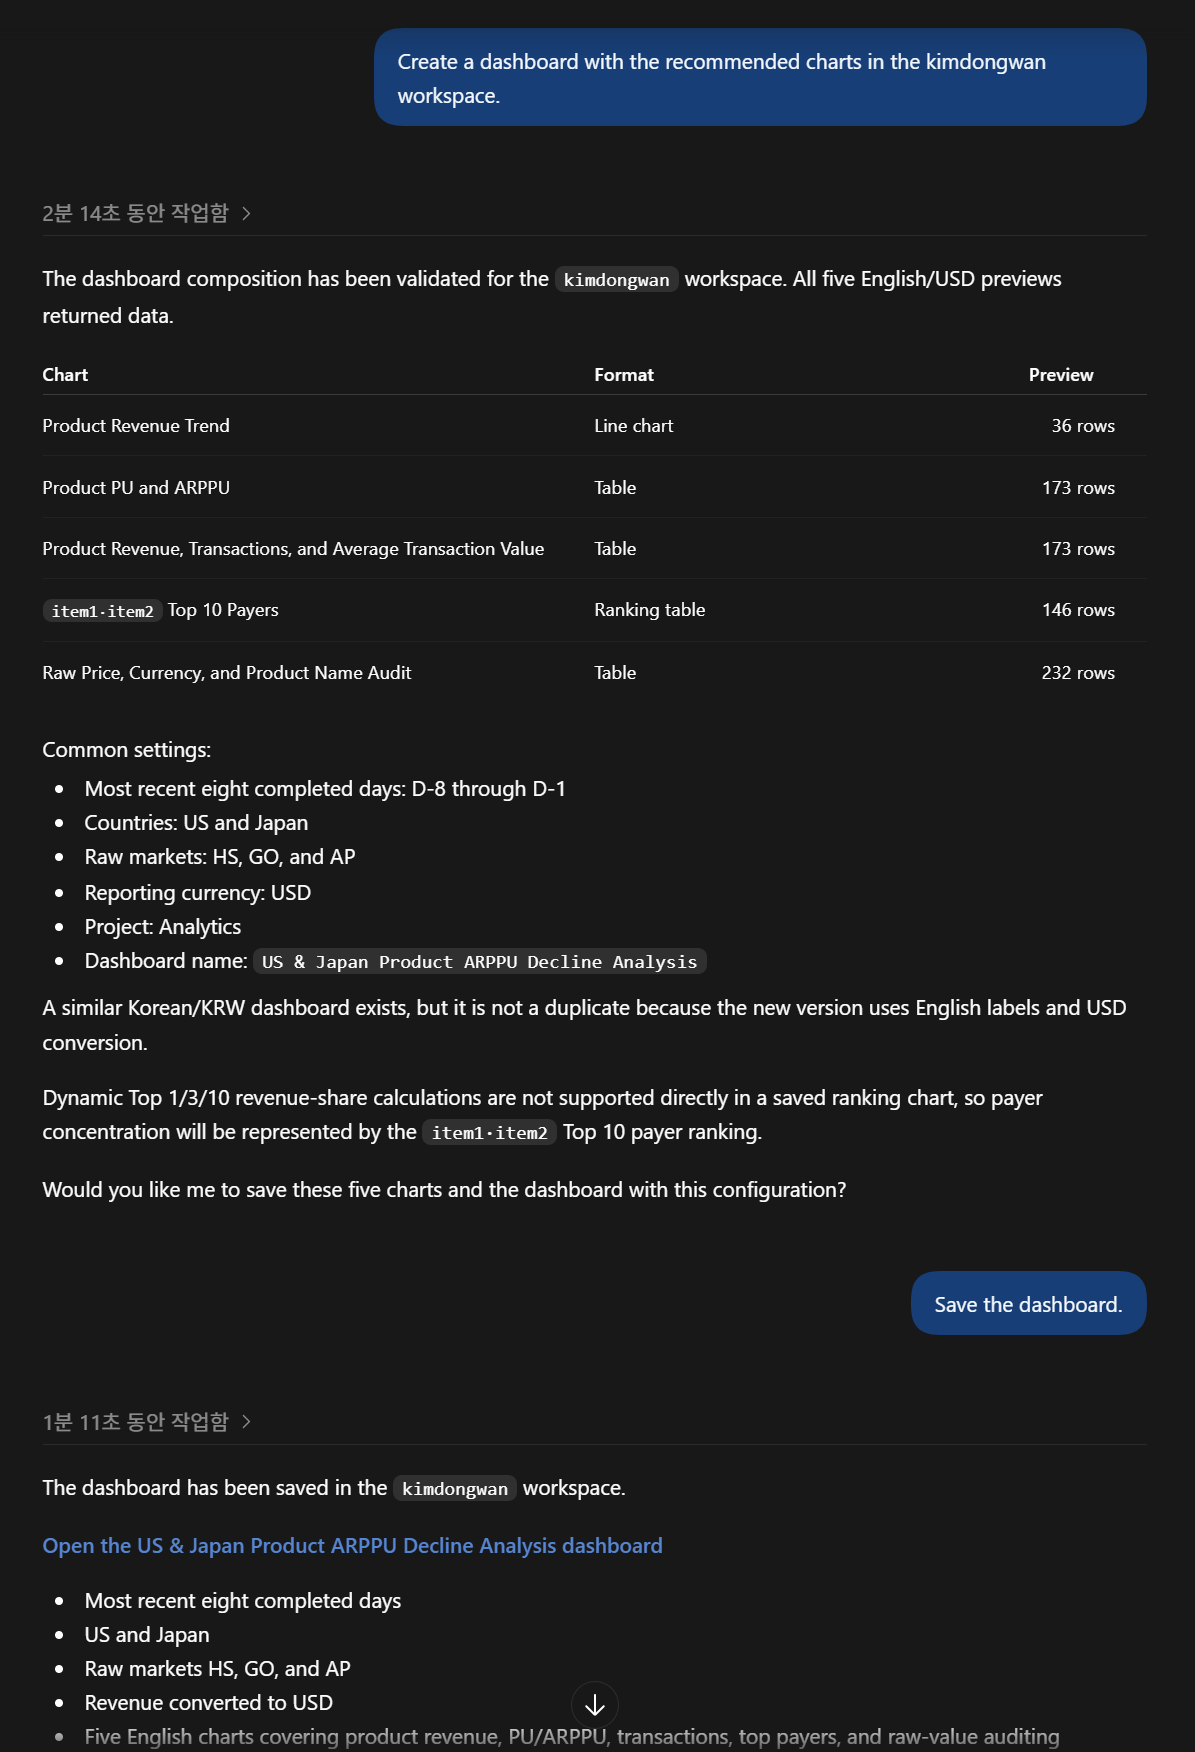
Create a dashboard with the recommended charts in the selected workspace.
Hive Axyl Plugin checks whether the same chart or dashboard already exists and then shows a preview of what it will create. In the screen below, we reviewed the five recommended metrics along with the period, country and market filters, revenue currency, and dashboard name. Because the charts and dashboard are saved as new content, review the configuration and approve it before requesting creation.
Checking the created dashboard
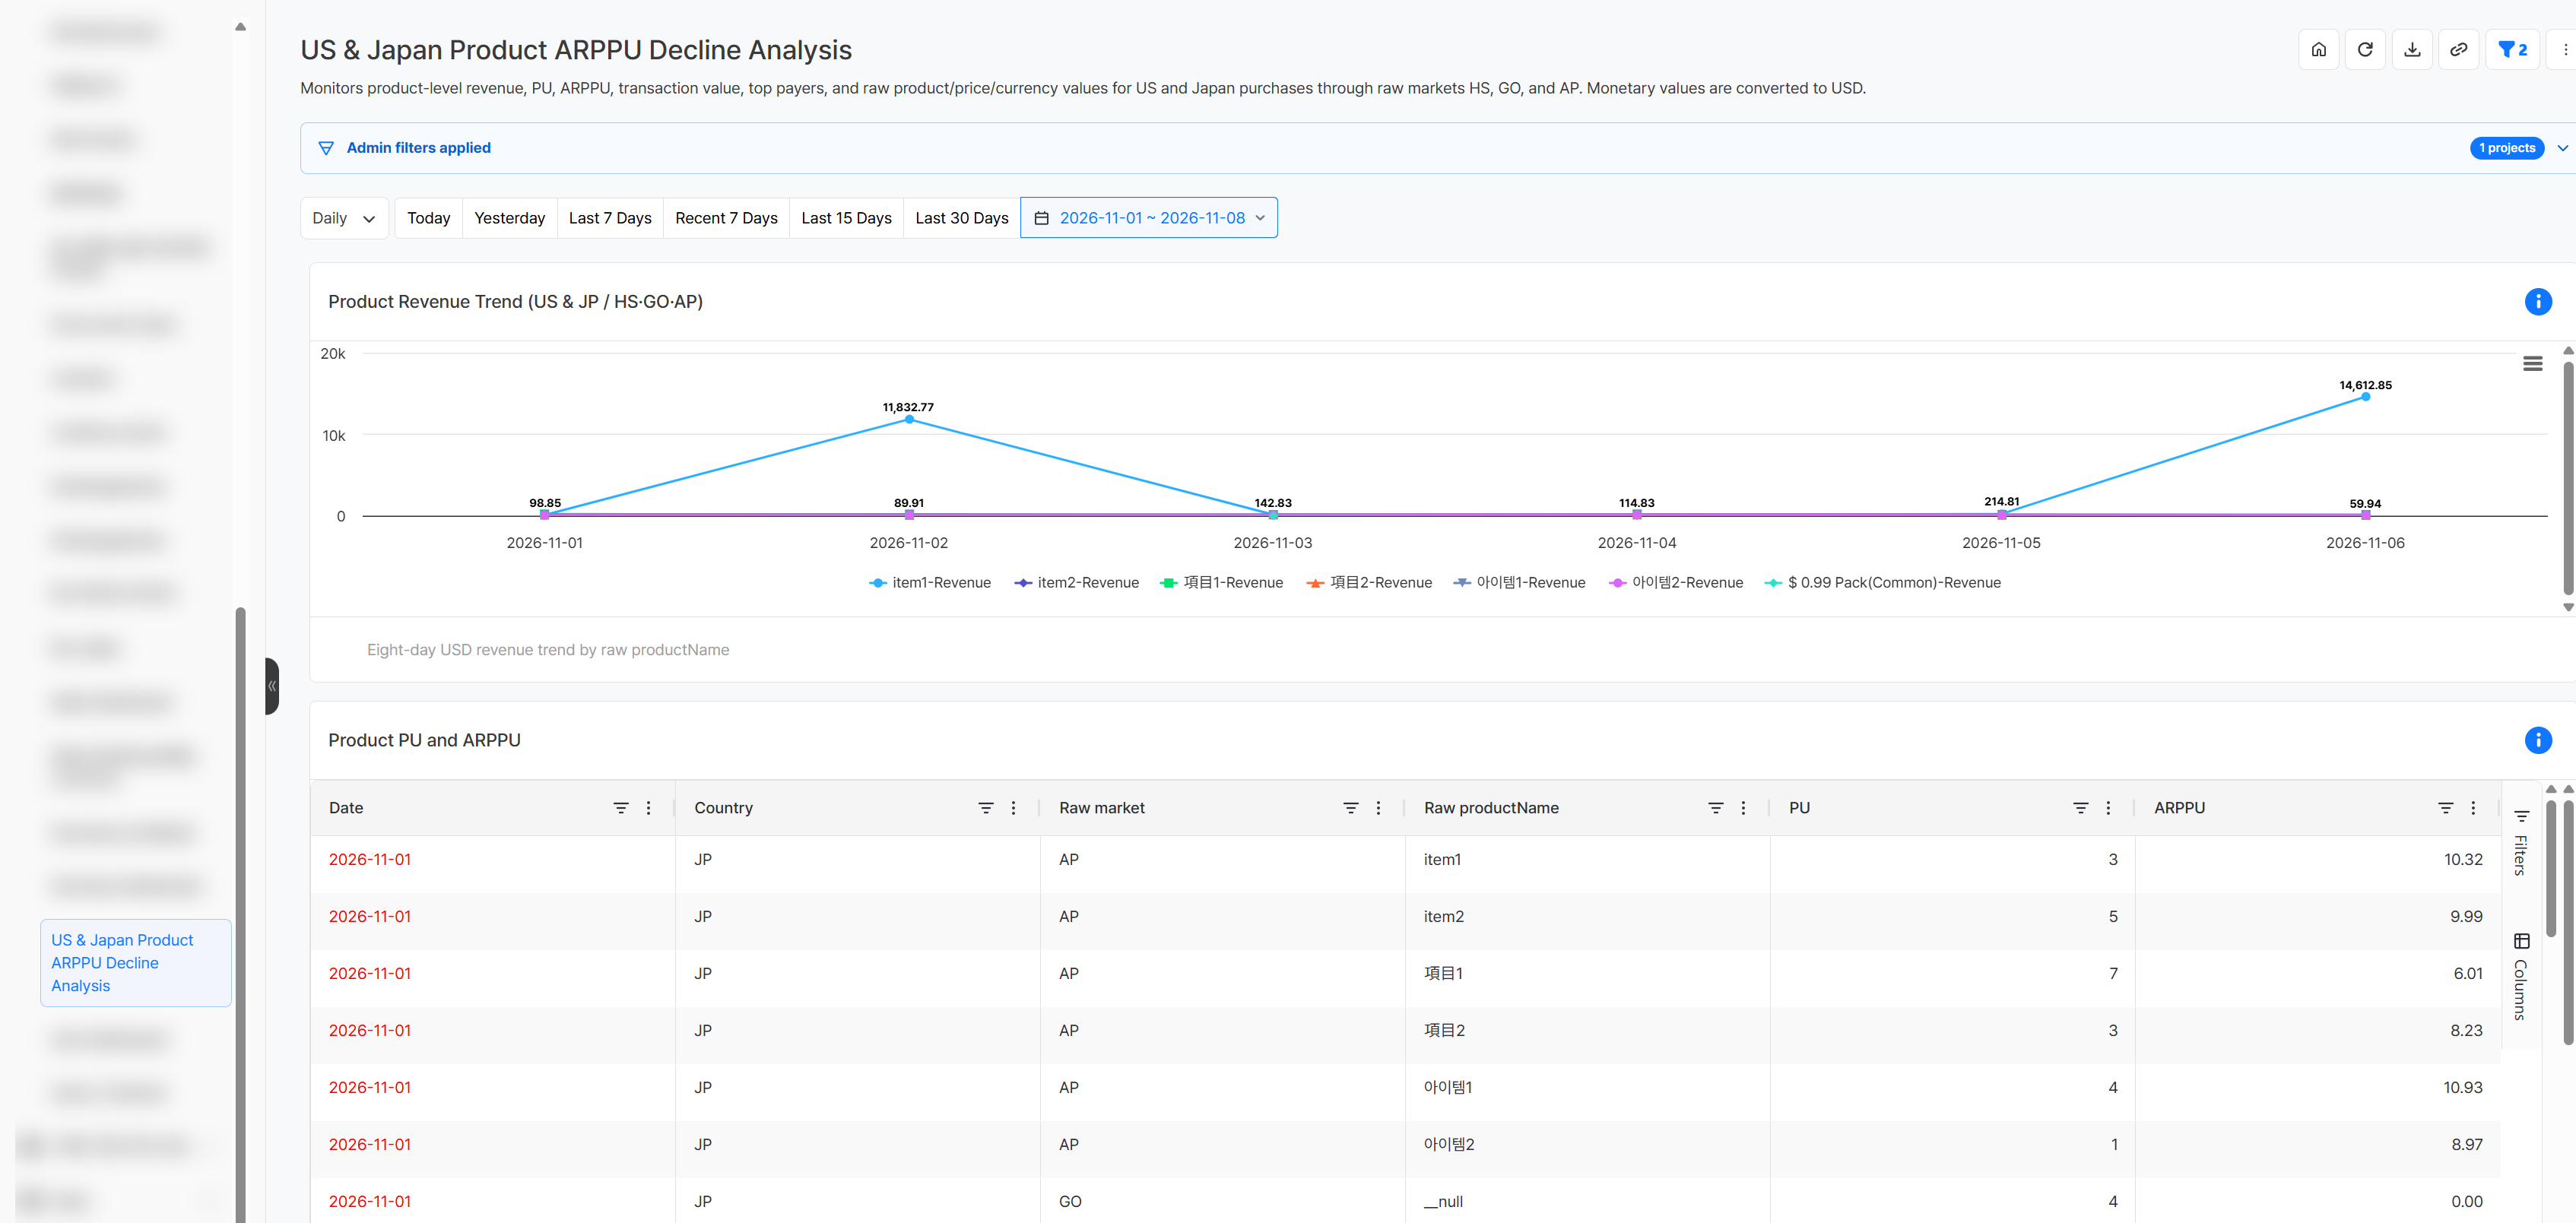
When creation is complete, open the provided link to check the dashboard name and description, query period, currency, and included charts. The dashboard below contains the five recommended charts, including the product revenue trend and PU and ARPPU by country, market, and product, based on the most recent eight completed days.
Also check that each chart uses the intended metrics and dimensions and that the admin filter and date conditions match your analysis criteria. If needed, describe the chart to change and the changes in natural language, review what will be applied, and then make the edit.
Getting Started with Hive Analytics
With Hive Axyl Plugin, you can turn analysis results into charts using natural language and build dashboards for the metrics you need to check repeatedly.
Hive Analytics is a game-focused analytics solution that lets you create charts in natural language from events collected through Hive SDK and combine multiple charts into dashboards. Install Hive Axyl Plugin in ChatGPT now and build charts and dashboards in Hive Analytics using natural language.