Grouping Dimension Values by the Criteria You Need
Raw dimension values such as country codes, prices, and levels are often more useful when regrouped into regions or ranges that fit the purpose of your analysis than when viewed as they are. With Bucket settings in Hive Analytics charts, you can leave the raw logs unchanged and turn text values into groups and numeric values into buckets, entered manually or split at equal widths, then compare them as new dimension values. Values you haven't assigned can also be gathered under a single label and reviewed together.
Dimension Values That Need to Be Reclassified for Your Analysis
Dimension values in game data are divided by the raw values as collected. Countries are recorded by country code, such as KR, JP, and US, and numeric attributes such as price or level are collected as individual numbers.
In data analysis, rather than looking at raw values as they are, you often need to split numeric values such as price or level into ranges, or group country codes into regions for comparison. Data analysts need to restructure collected values into criteria that support decision-making and apply different classification approaches depending on the purpose of the analysis, the audience of the report, and the operational situation.
If you can group multiple values together or adjust numeric ranges into buckets on screen while keeping the raw data intact, you don't need to build separate queries or processed data again and again. Analysts can apply the criteria they need themselves and quickly compare results from multiple perspectives, which shortens analysis preparation and helps define the scope of follow-up analysis.
Bucket Settings in Hive Analytics
In Hive Analytics charts, you can apply Bucket settings to a selected dimension to build new dimension values from the raw values. For a text dimension, you can select one or more values and group them together. For a numeric dimension, you can split the range into buckets or combine multiple values into a group.
Buckets for a numeric dimension can be created by entering ranges manually or with Equal-width setup. In Equal-width setup, you specify the minimum, the maximum, and the number of buckets, and the range is split at equal intervals. For example, setting the minimum to 0, the maximum to 100,000, and the number of buckets to 4 automatically creates four buckets: 0~24,999, 25,000~49,999, 50,000~74,999, and 75,000~100,000. For both text and numeric dimensions, values you haven't assigned can be shown together under one label, so you can also check the remaining values that fall outside your analysis.
The groups and buckets you configure appear as new dimension values in the chart. Without changing the values in the raw logs, you can apply the classification criteria your current analysis needs and compare measures.
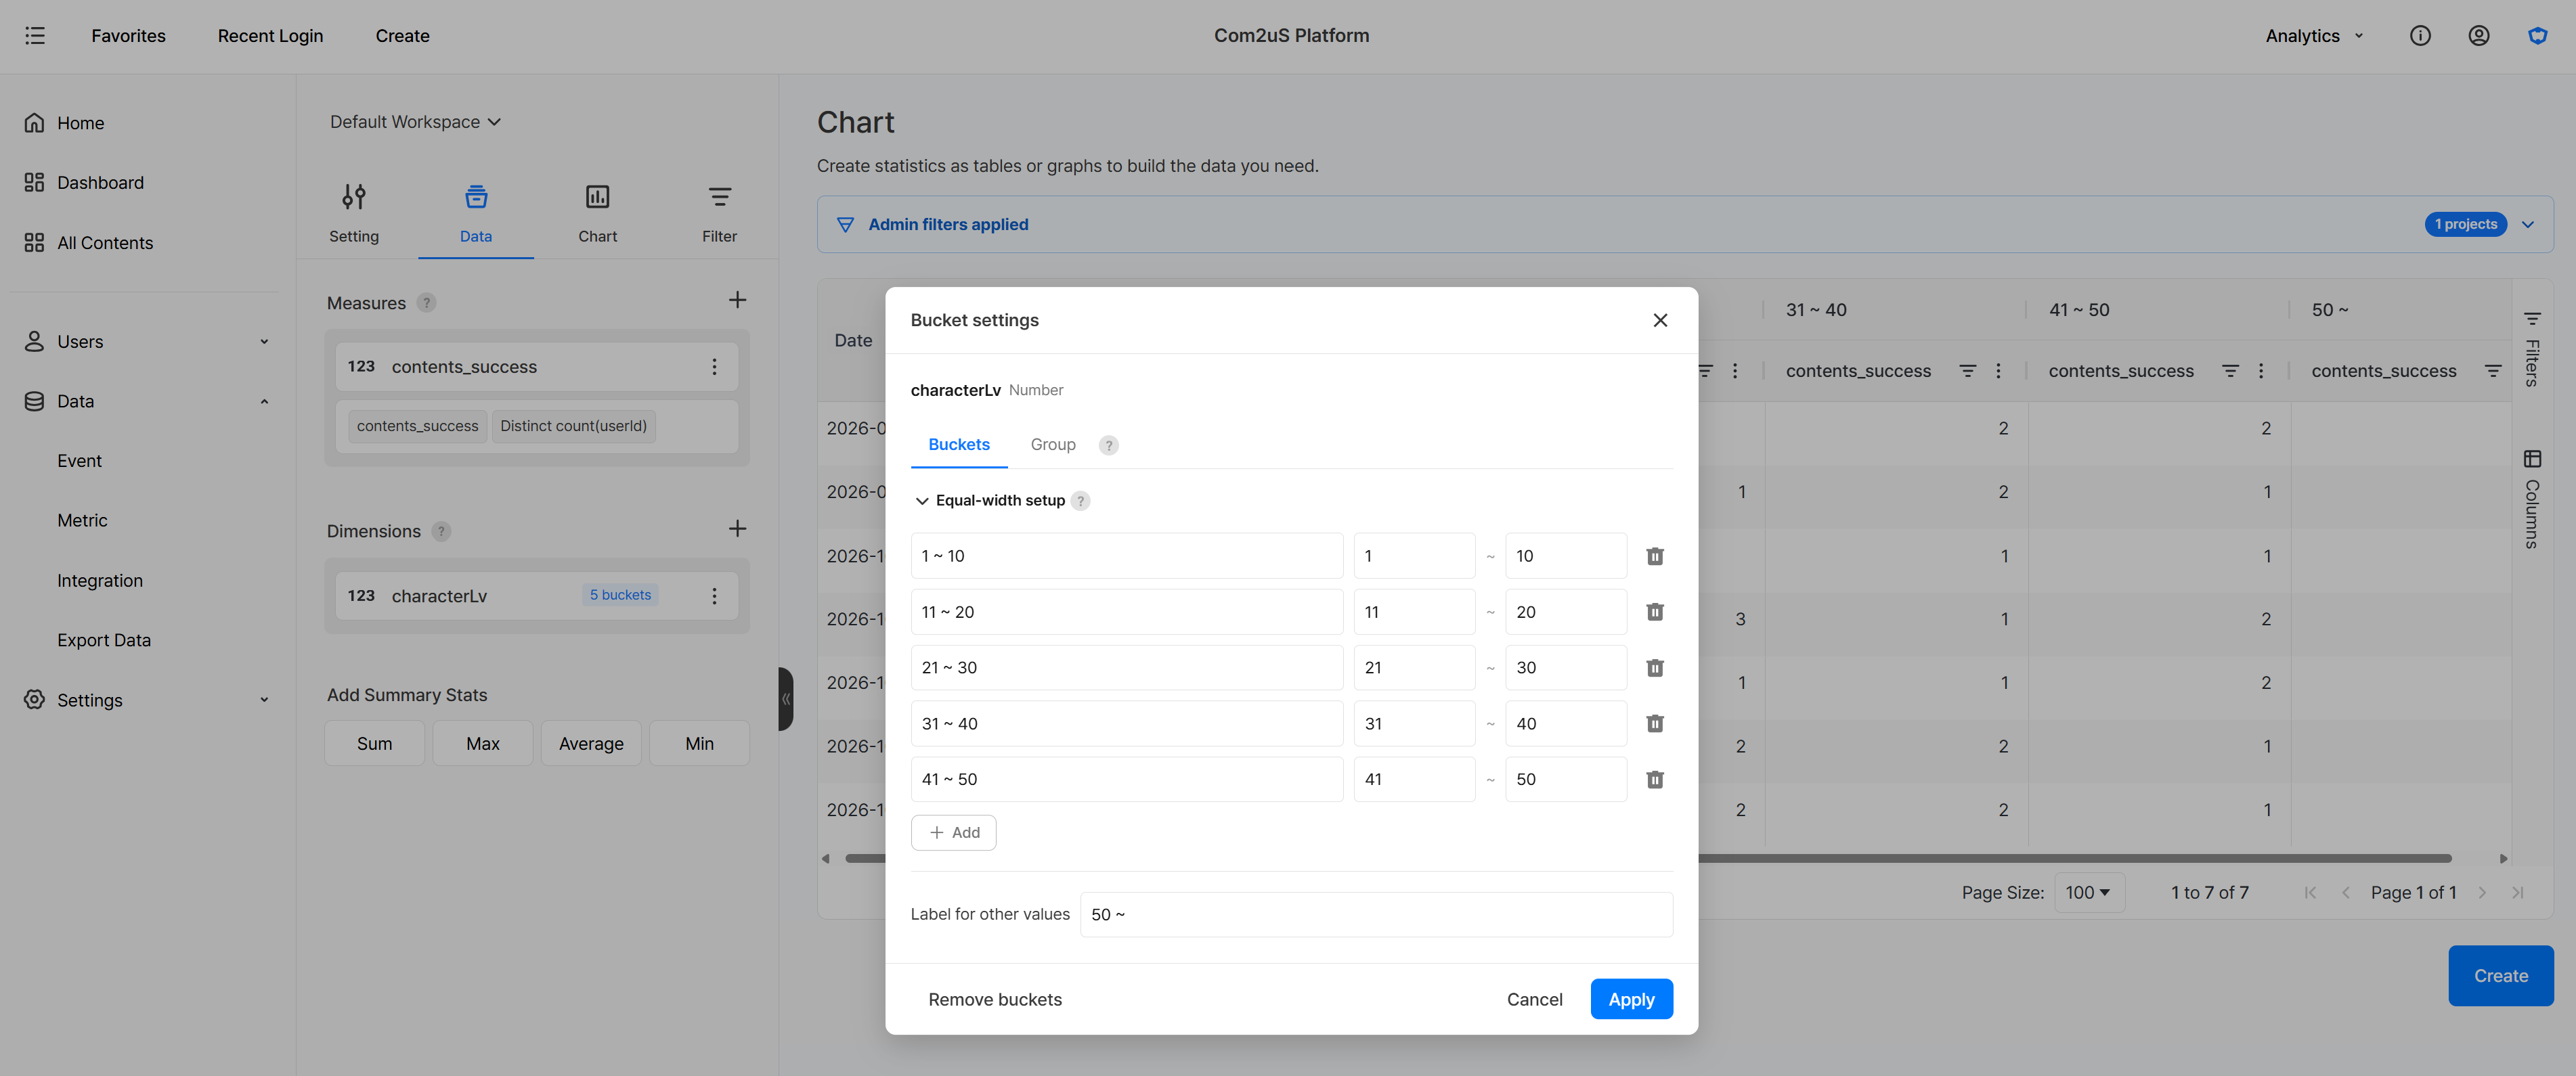
Configuring Dimension Values to Fit Your Analysis
Let's look at how to group text country codes by region and how to split numeric prices at equal intervals.
Grouping Countries by Region to Compare User Counts
To compare user counts by region, select AU as the measure and country as the dimension, then set up groups. In the screen below, KR, JP, and CN are grouped as Asia, and US and CA as America. The label for other values is set so that countries not included in any group appear as ETC.
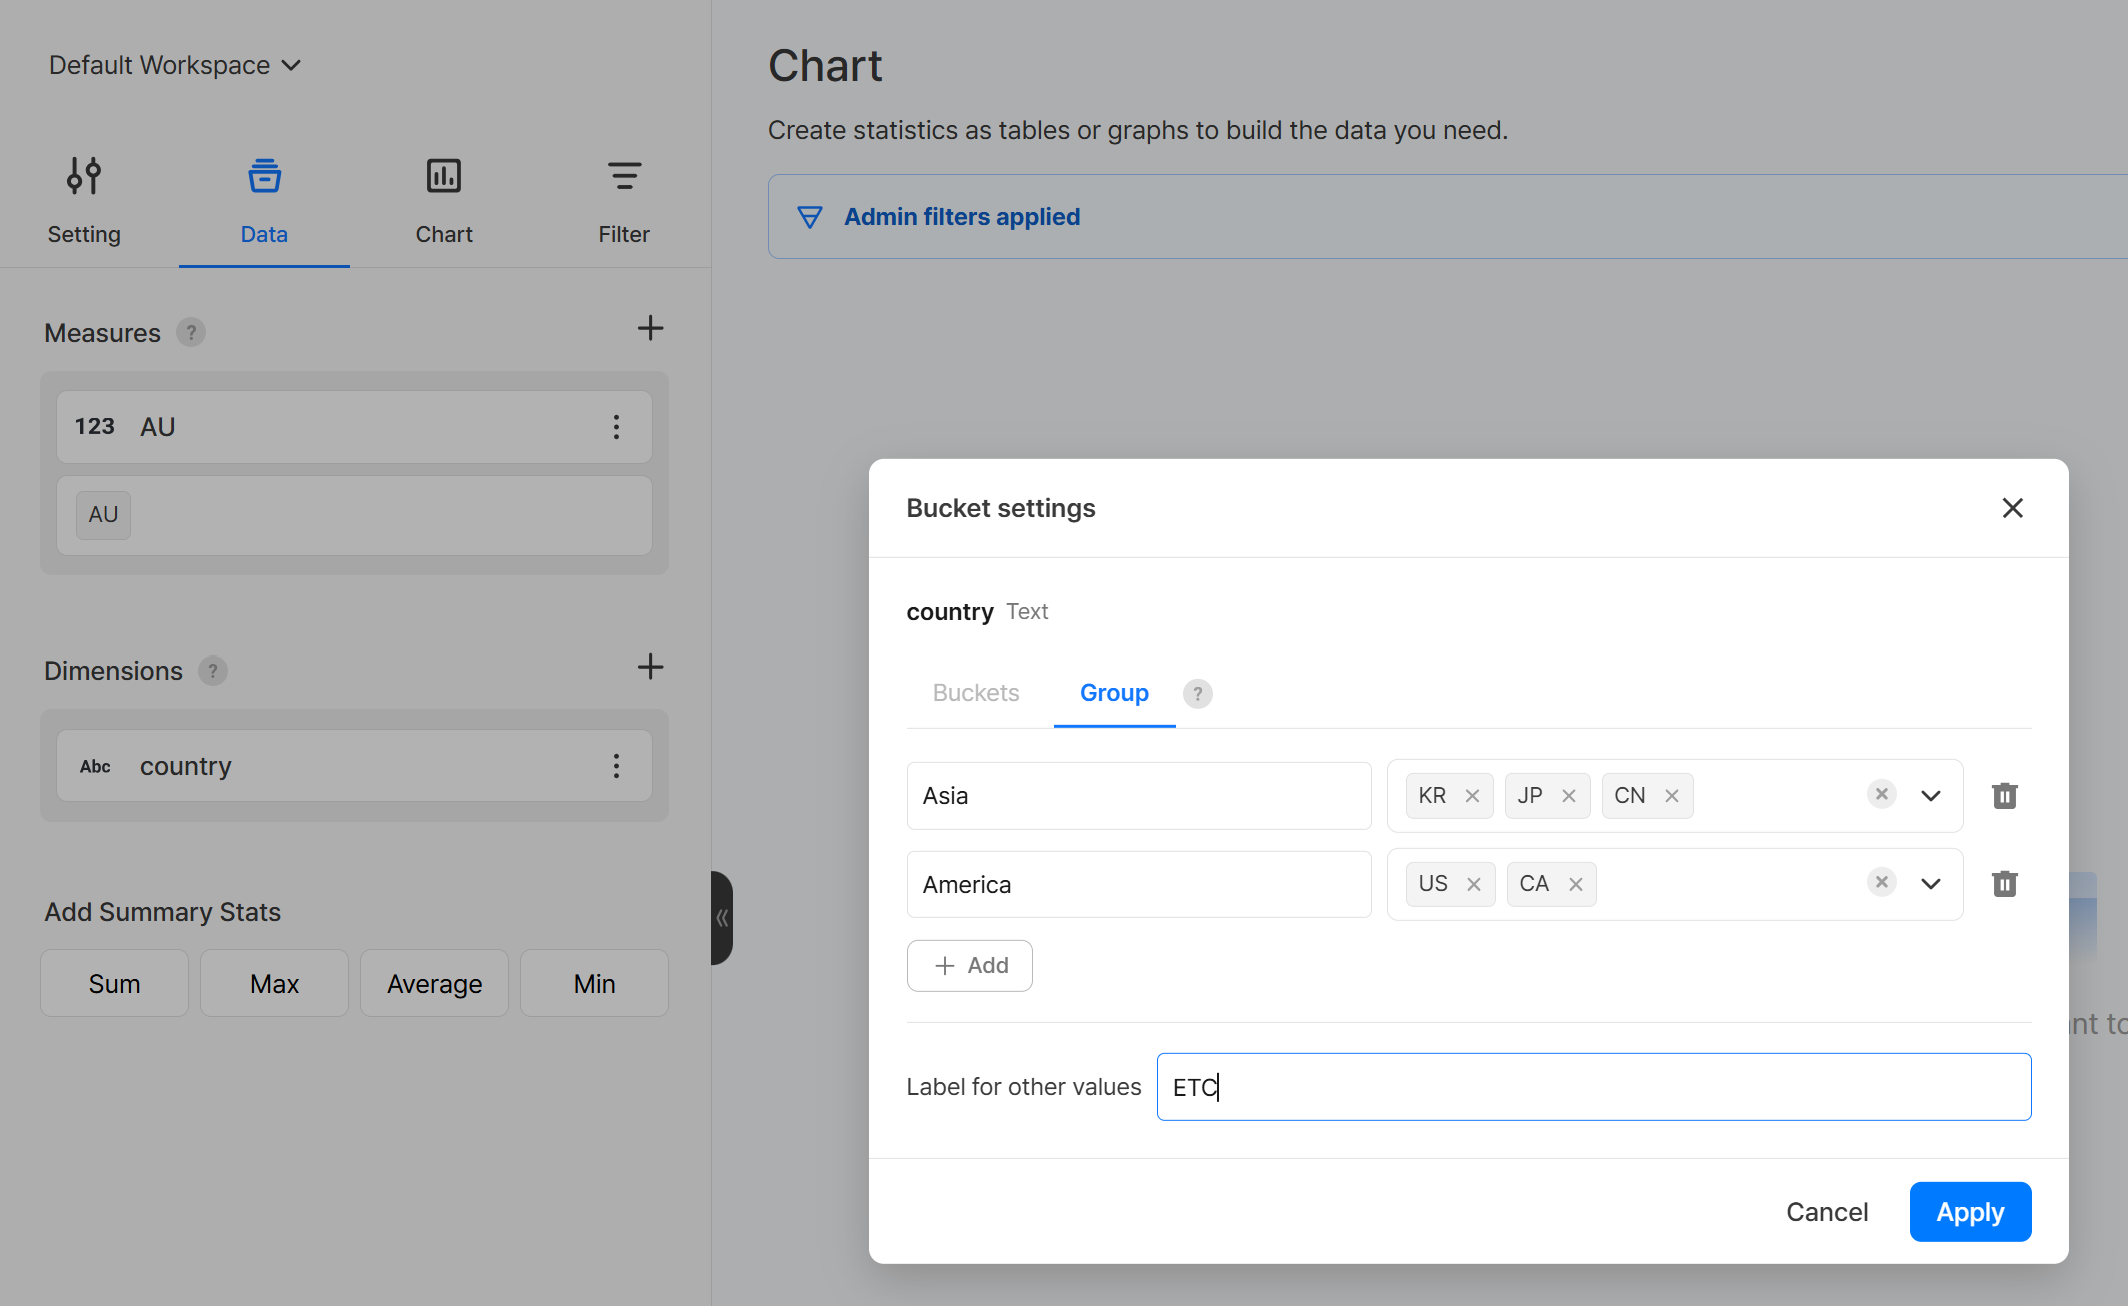
Once the groups are applied, Asia, America, and ETC appear as new dimension values in place of individual country codes. This lets you compare daily user counts by region without changing the raw data.
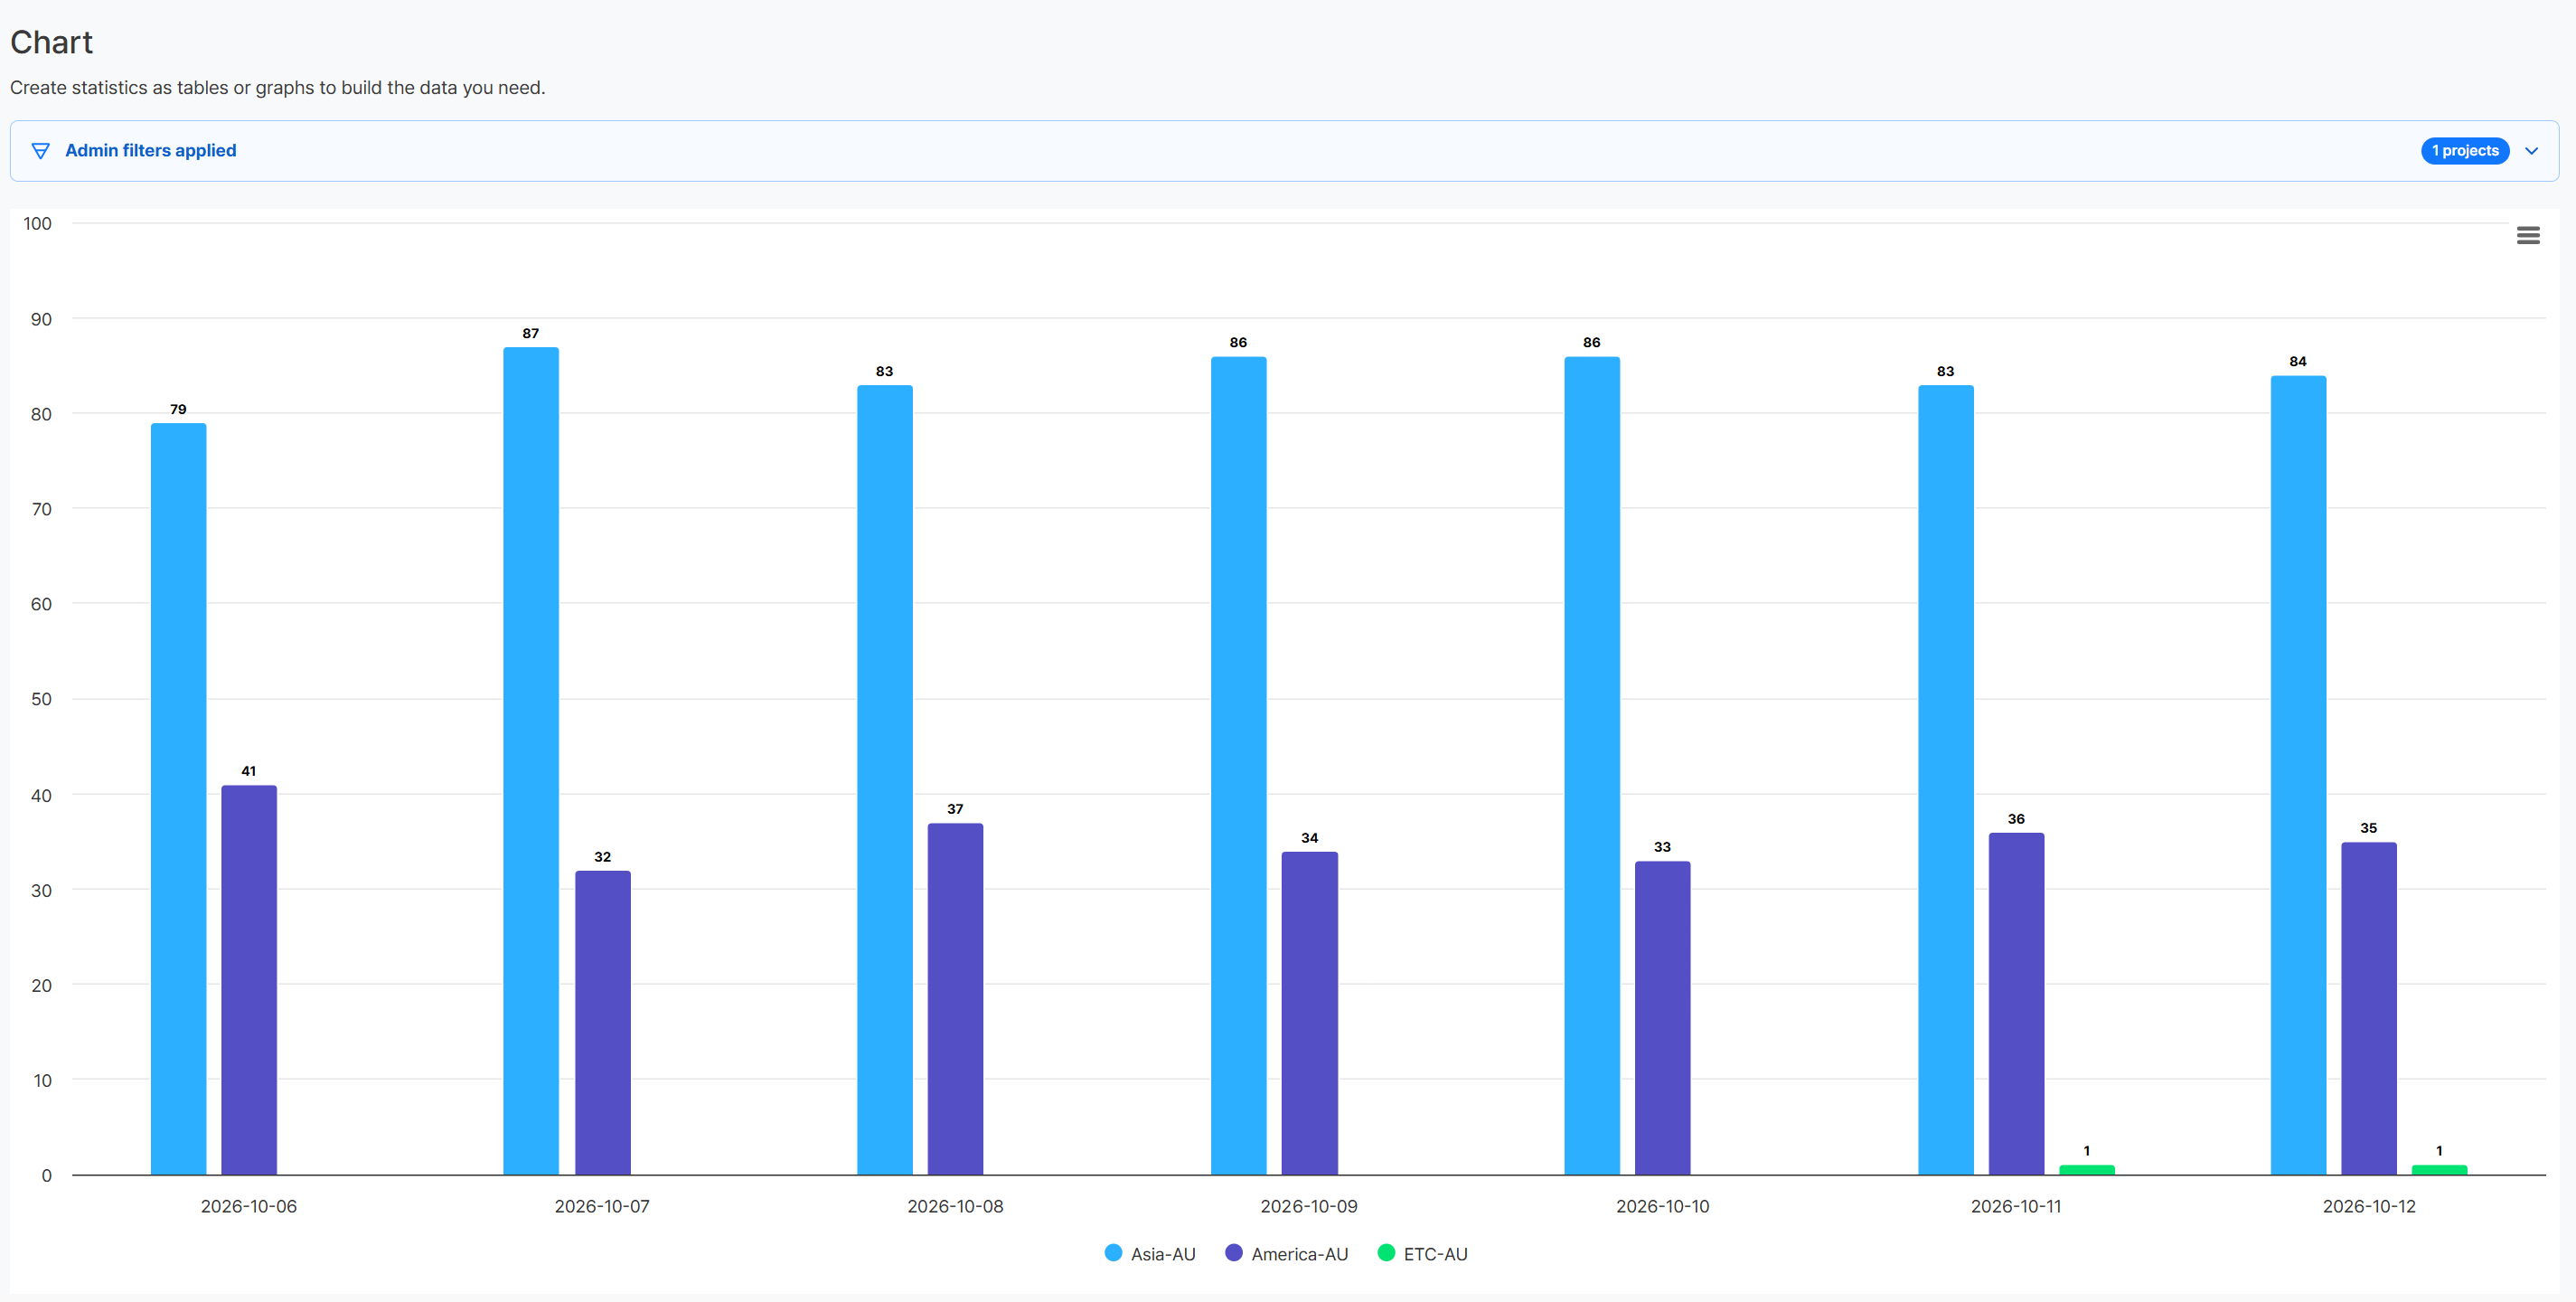
Splitting Prices at Equal Intervals to Check Purchasing User Counts
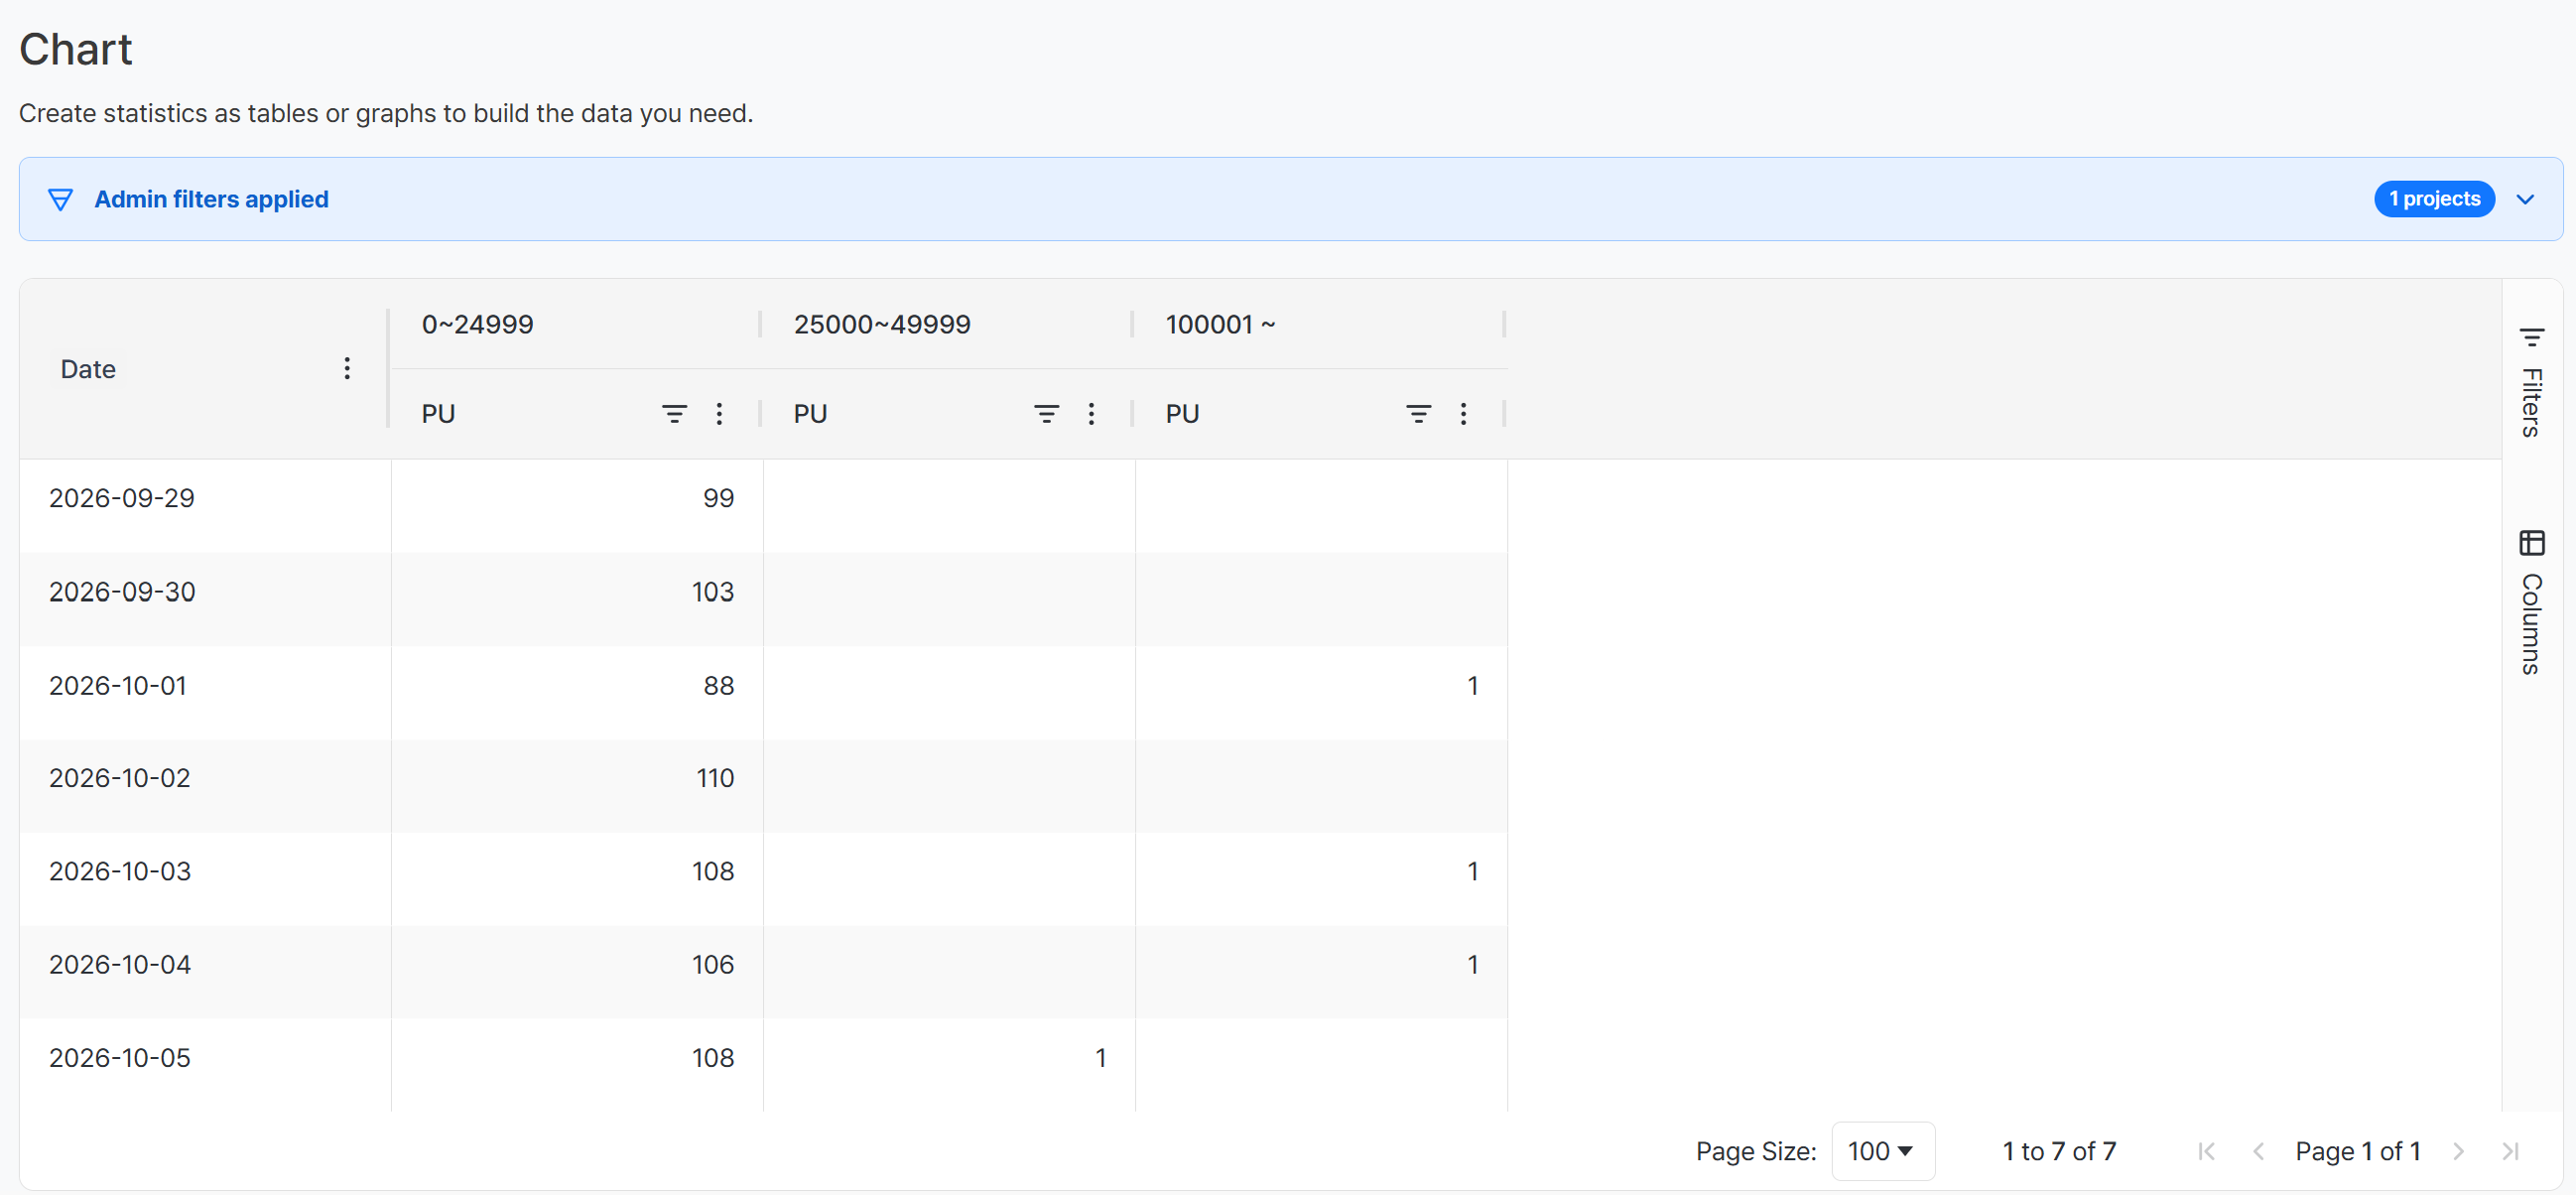
To compare the price ranges where purchases occurred, select PU as the measure and the numeric dimension price, then set up buckets. In the screen below, the minimum is set to 0, the maximum to 100000, and the number of buckets to 4 to split the price range at equal intervals. Values outside the set range are grouped and shown as 100001~.
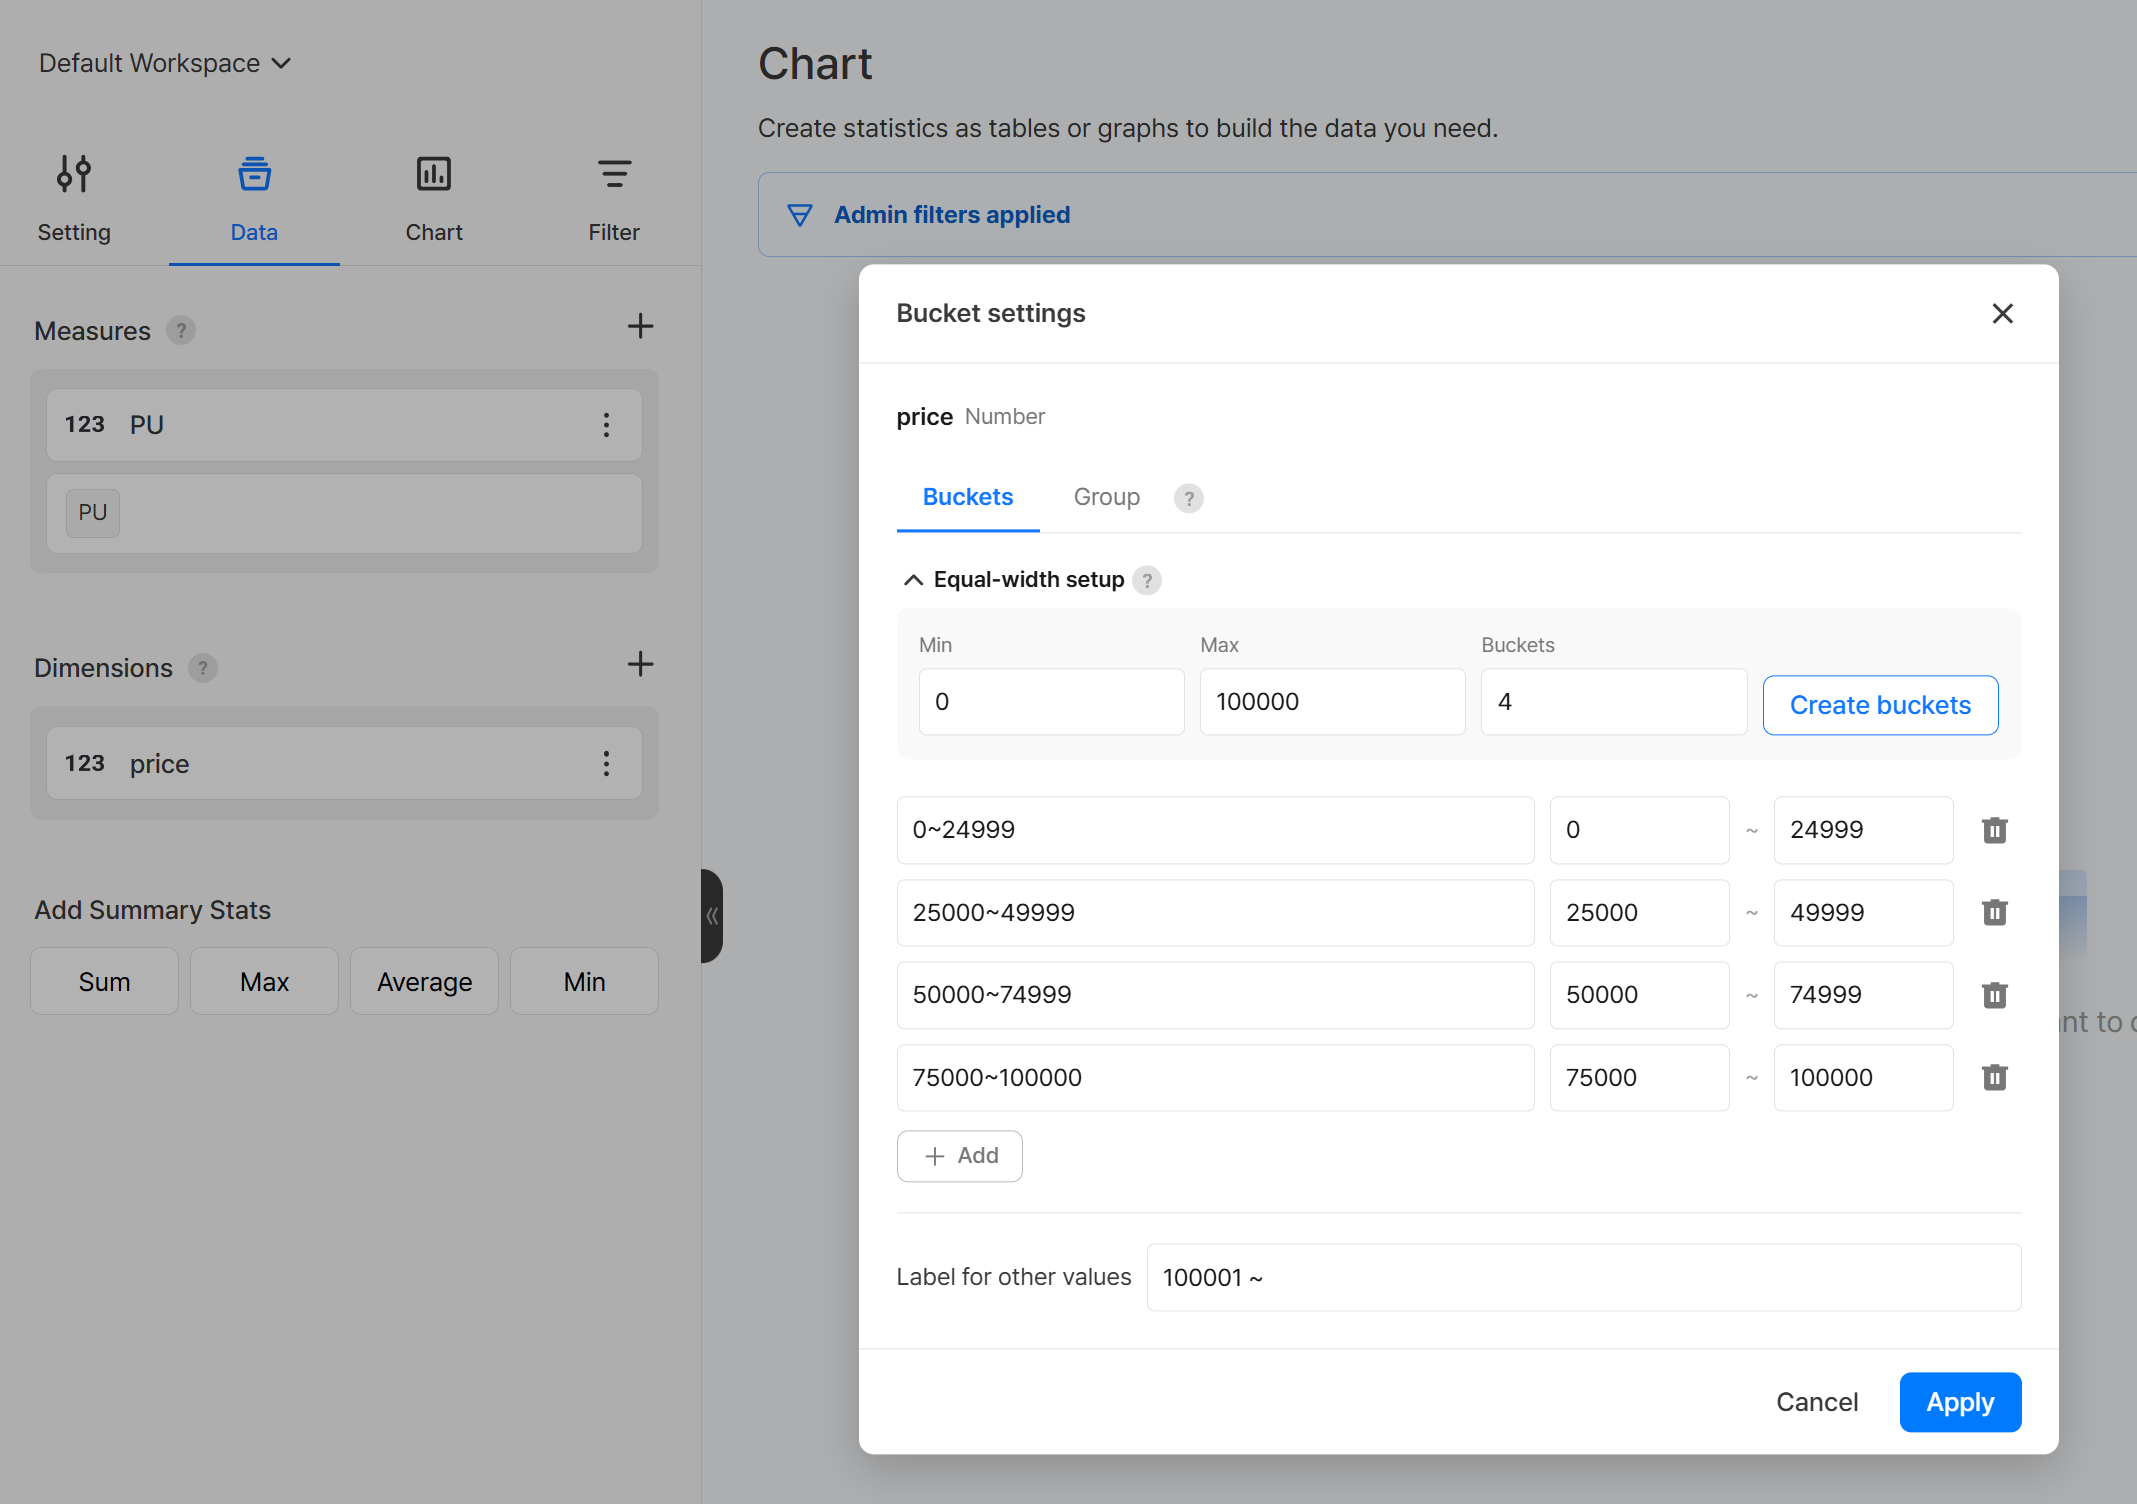
Applying Equal-width setup divides prices into 0~24999, 25000~49999, 50000~74999, and 75000~100000. In the chart, you can compare purchasing user counts by these price buckets to see which price ranges most purchases came from.
Get Started with Hive Analytics
With Bucket settings, you can keep the raw dimension values you've collected while configuring the groups and numeric ranges your current analysis needs right in the chart. You spend less effort developing new attributes or processing data separately each time your analysis criteria change, and you can compare the same data from multiple perspectives.
Hive Analytics is a game-specialized analytics solution that lets you analyze game events and attributes collected through the Hive SDK in charts. Configure dimension values to fit your analysis in Hive Analytics today and look at your data by the criteria you need.