Removing Test Data to Analyze Real Service Performance
When events from QA servers and test apps get mixed in with real service data, key KPIs such as user counts, revenue, and purchase conversion rate can end up looking different from reality. With Metric Filter Management in Hive Analytics, register a Server ID or App ID once and events matching that condition are excluded from every chart, funnel, retention, and dashboard at once. Even if you run several QA servers or test apps, you can analyze KPIs based on real service data without repeating the same setup.
When Test Environment Data Gets Mixed Into Your Analysis
While developing and verifying a game, events such as login, purchases, and content usage keep occurring on QA servers and test apps as well. If these records are counted alongside real service data, key KPIs such as user counts, revenue, and purchase conversion rate can shift.
You could set a Server ID or App ID filter on each chart, but the more analysis screens you have, the more often you need to repeat the same condition. You can also end up leaving the condition out of a new chart, or having to manually update every existing dashboard.
Analysis Needs a Consistent Standard
Data analysts need to calculate KPIs based on real service performance and visualize them in dashboards that multiple teams can use. If QA activity or test purchases are included, it becomes hard to tell whether a change in the numbers came from real user response or from testing.
This is especially true around a launch or an update review period, when test records can concentrate in a short window. To keep repeated analysis accurate, you need to separate service and test environments under the same condition on every screen.
Metric Filter Management in Hive Analytics
Metric Filter Management in Hive Analytics is a feature that excludes event data generated on a QA server or a test app ID from your metrics. Register a condition per project by selecting a property, and events from that environment are excluded from charts, retention, and funnels right away, with the same condition applied to dashboards already in use.
When registering a filter, you can choose App ID or Server ID as the property, and register one or more values under the property you selected. Even if you run several QA servers or test apps, managing the related values in one place reduces the burden of repeating the same filter on every analysis screen.
The filter list shows the project, property, and property values currently excluded. To change a condition, you need to delete the existing entry and register it again — removing a filter means data from that server or app can be included in your numbers again.
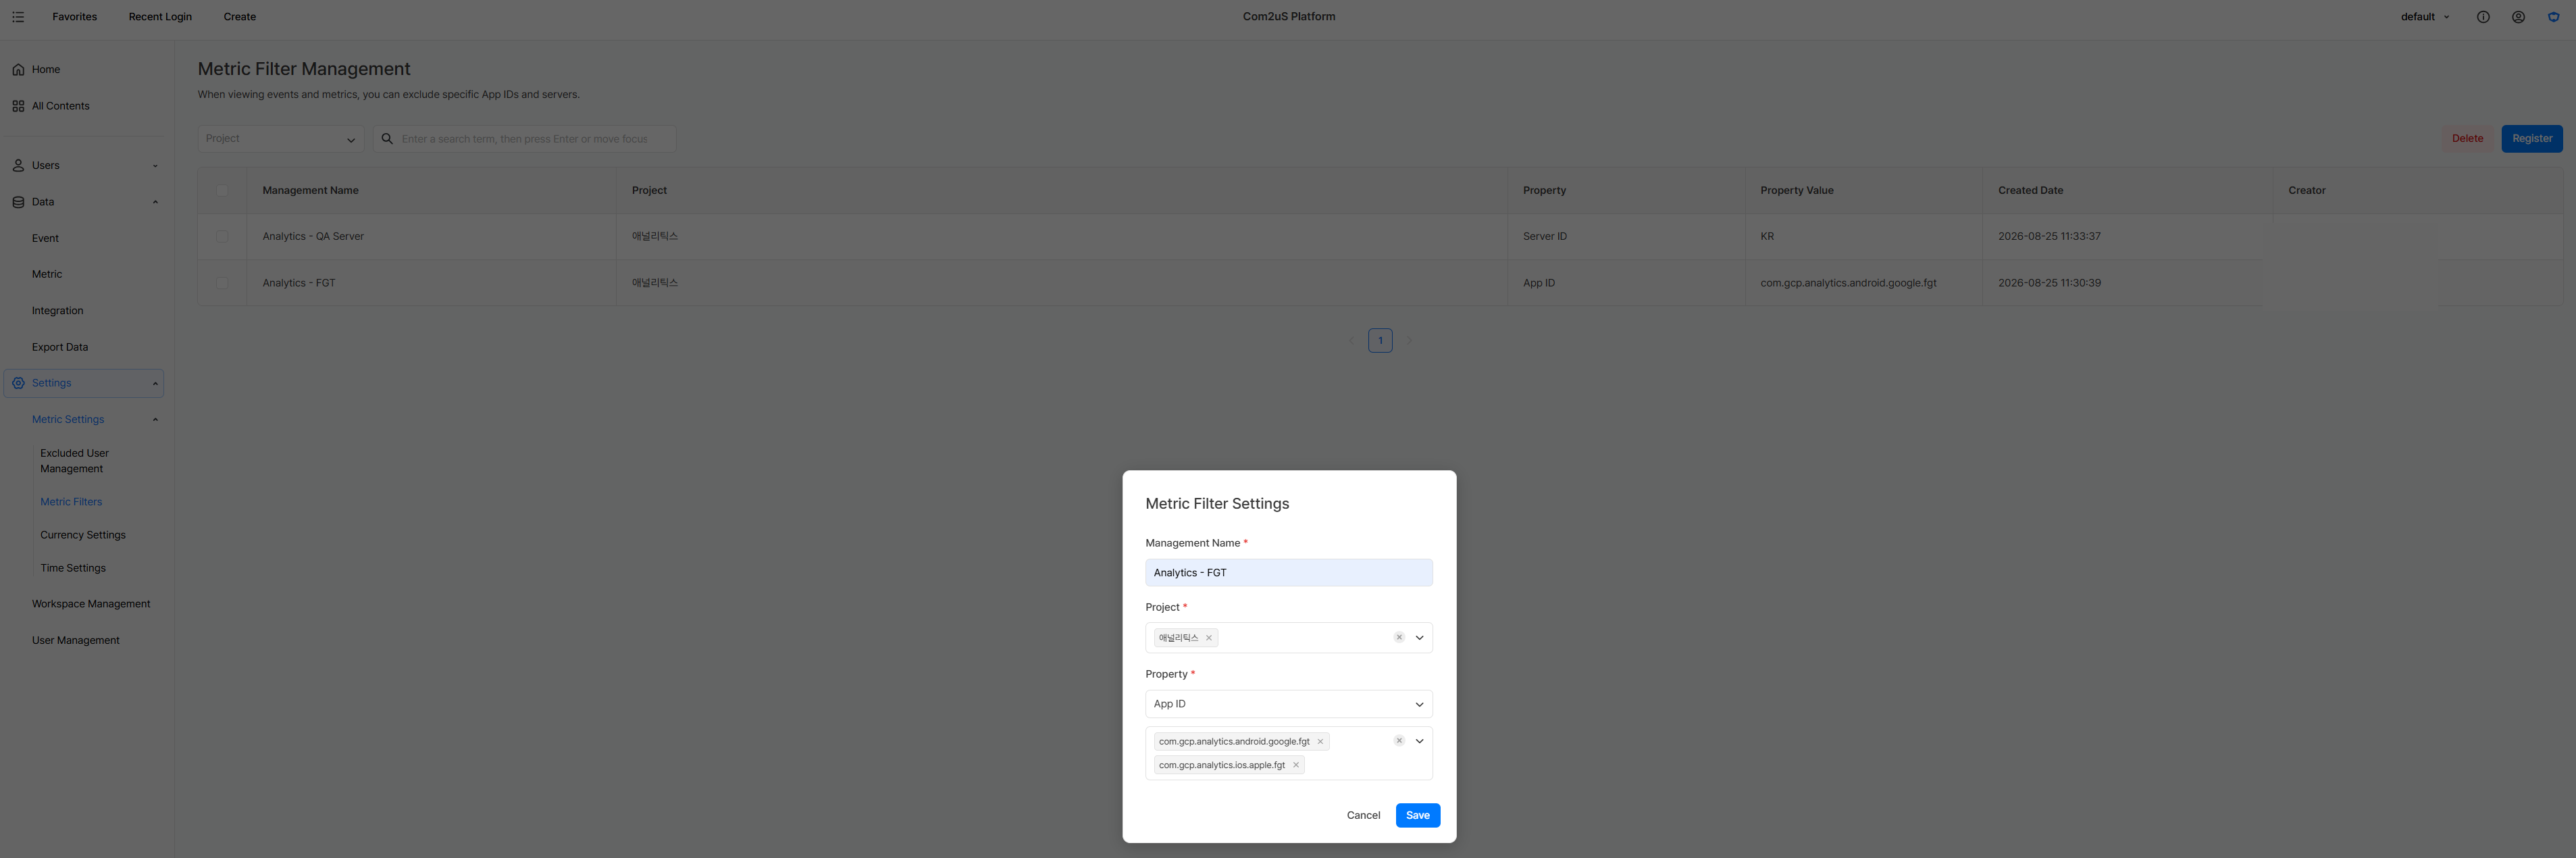
QA server and FGT conditions registered in the list apply to every chart, retention, funnel, and dashboard at once.
Managing KPIs on a Real Service Data Basis
Once a metric filter is set, you can analyze key KPIs and visualize them in a dashboard with the test environment separated out.
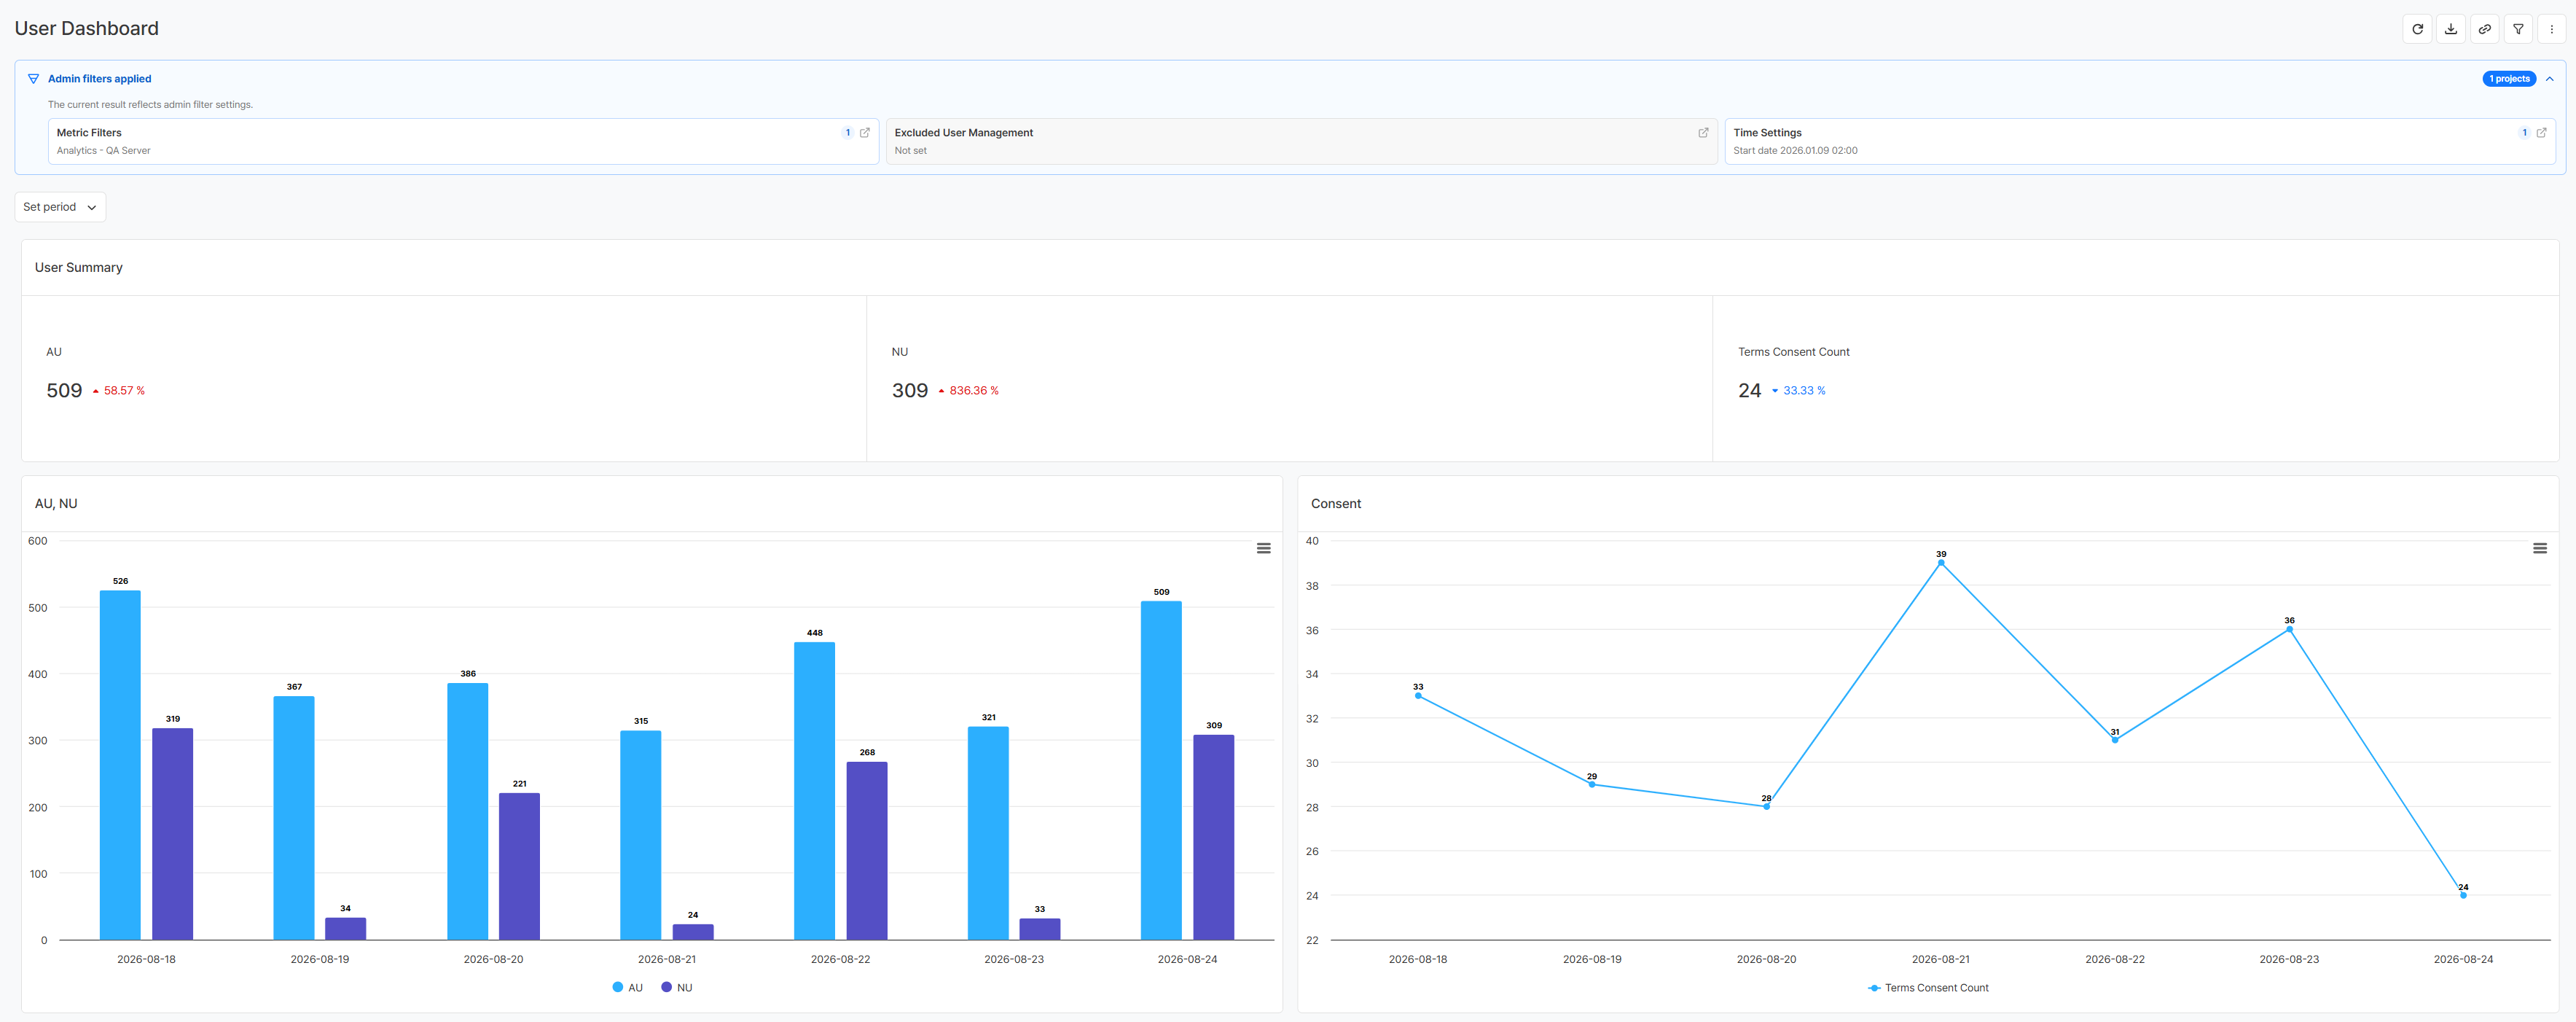
Checking User Metrics With QA Servers Excluded
Repeated logins and content usage on a QA server for feature verification can make Active Users (AU) and content-engagement counts look higher than they really are. Excluding that Server ID lets you look at the trend based on users who were active in the service environment.
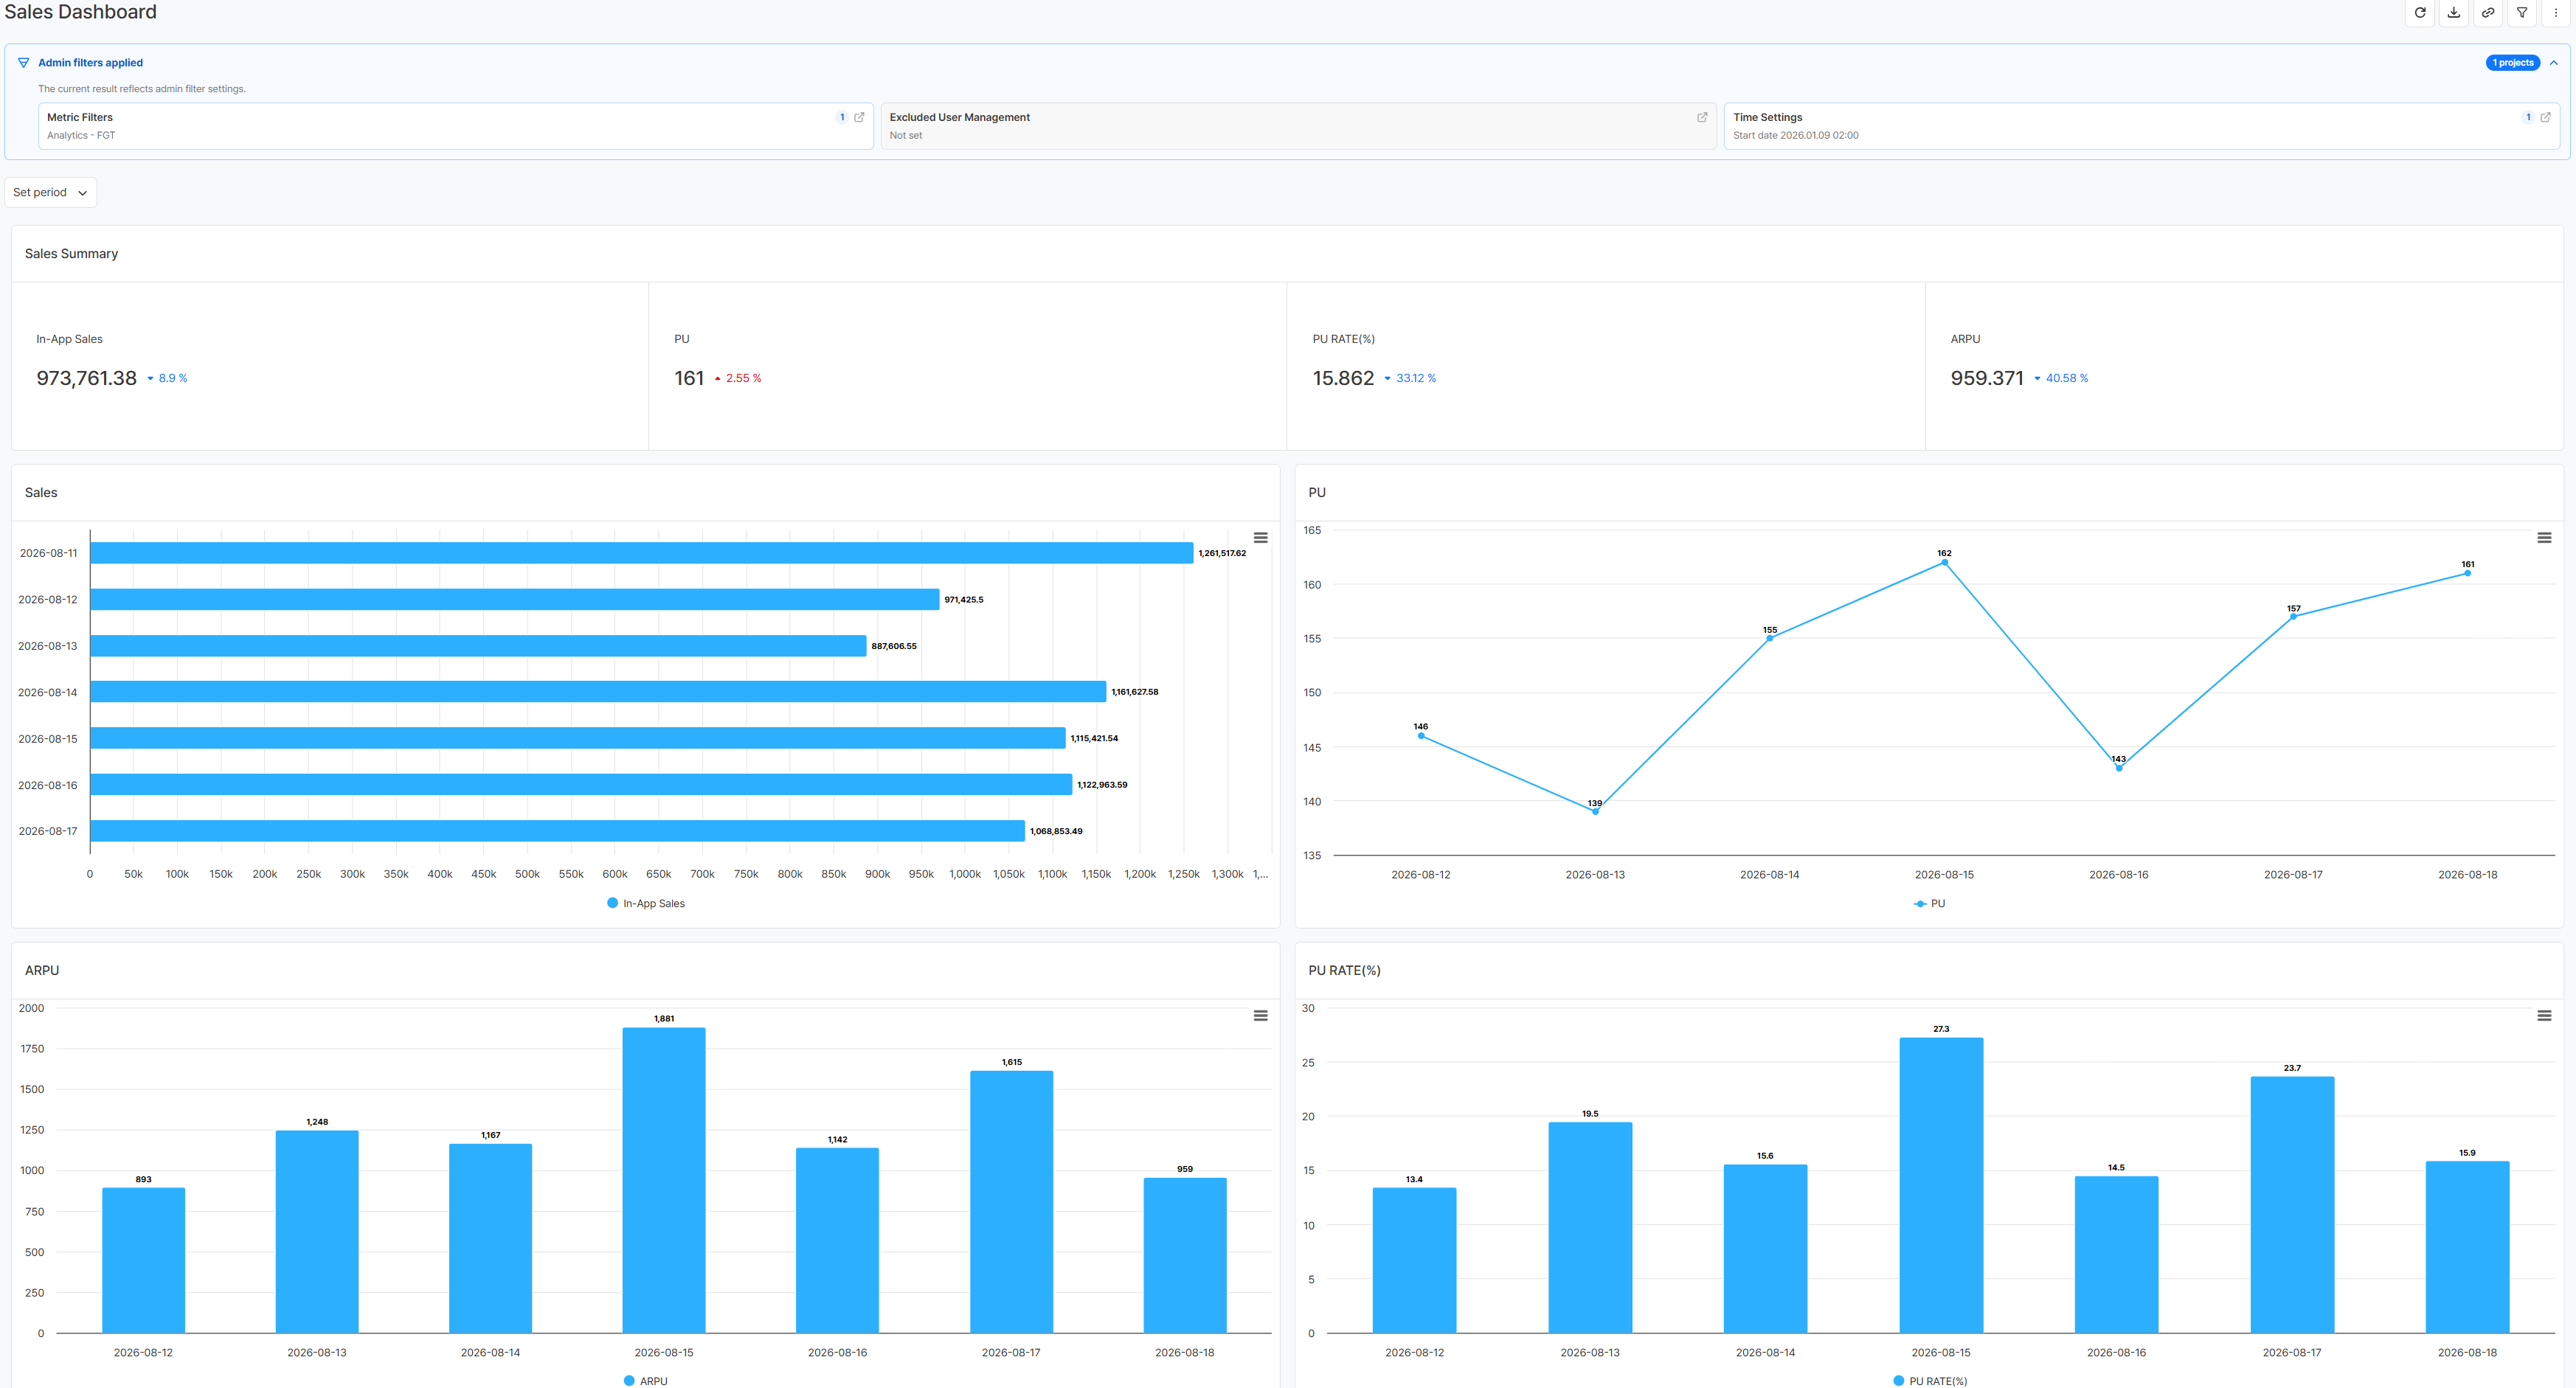
Analyzing Purchase Performance With Test App IDs Excluded
A test app used to verify payment integration or a product listing can generate repeated trial purchases. Registering the App ID as a filter separates out test records so you can focus on real revenue, paying user count, and purchase conversion rate.
Checking the Cause of an Unusual Number
If you see a number that looks different from usual, start by checking the metric filters currently applied and the Server ID or App ID values. If a test environment was added or an identifier changed, updating the filter keeps later analysis on the same standard.
Get Started with Hive Analytics
Go to Settings > Metric Settings > Metric Filters to register a test App ID or QA server as a metric filter. Keep the list updated regularly to maintain a consistent basis for analysis.
Hive Analytics automatically collects game data through the Hive SDK, and with Metric Filter Management you can exclude data from QA servers and test app IDs to analyze key KPIs right away — a game-focused analytics solution. Start now with Hive Analytics to separate out test environment data and review your real service data on a consistent basis.