Finding the Players Who Drive Your Game Revenue
Aggregated revenue totals make it hard to find your top performers. Hive Analytics Ranking aggregates the whole selected period into one and ranks results by a measure; when you select two or more dimensions, you can rank across all data or within each dimension. Use player revenue rankings to find VIP candidates, and market and product rankings to narrow down follow-up analysis.
Top Performers Are Hard to Spot From Numbers Alone
Game revenue is often checked through aggregated metrics such as total revenue or number of purchases. These metrics alone don't immediately show how much each player or product contributed to overall revenue. You can re-aggregate revenue by target and sort it to find the top performers, but every time the period or comparison criteria change, you have to repeat that analysis.
Top Revenue Metrics for Business Decisions
Business managers need to see which players contributed most to revenue in order to understand revenue performance and prioritize follow-up actions. Comparing revenue per player on the same basis makes it possible to identify key revenue contributors concretely.
Finding the top players in a per-player revenue ranking helps you select VIP management targets and review tailored benefits or operating policies. Breaking the ranking down by market pinpoints the players who contributed most in each market, and checking a product revenue ranking alongside it shows which products were purchased most, quickly narrowing the scope of follow-up analysis.
Ranking in Hive Analytics
Ranking in Hive Analytics calculates ranks based on a selected measure and displays dimension values alongside the results. Select Ranking from the Create menu, then set the project, period, measures, and dimensions. At least one dimension is required, and you can choose ascending or descending order and how many ranks to display. Up to 500 ranks can be displayed.
Ranking aggregates the entire selected period as a single range. For example, if you select 7 days, ranks are not calculated per day; dimension values are ranked by the measure aggregated over those 7 days.
When you select two or more dimensions, you can choose Combined or Per dimension as the ranking method. Combined ranks across all data regardless of dimension. Per dimension ranks the last dimension separately within each combination of the preceding dimensions. For example, setting dimensions in the order market → userId lets you see player ranks for each market separately. Along with the ranking method, you can also choose how items with equal values are ranked, depending on your analysis criteria.
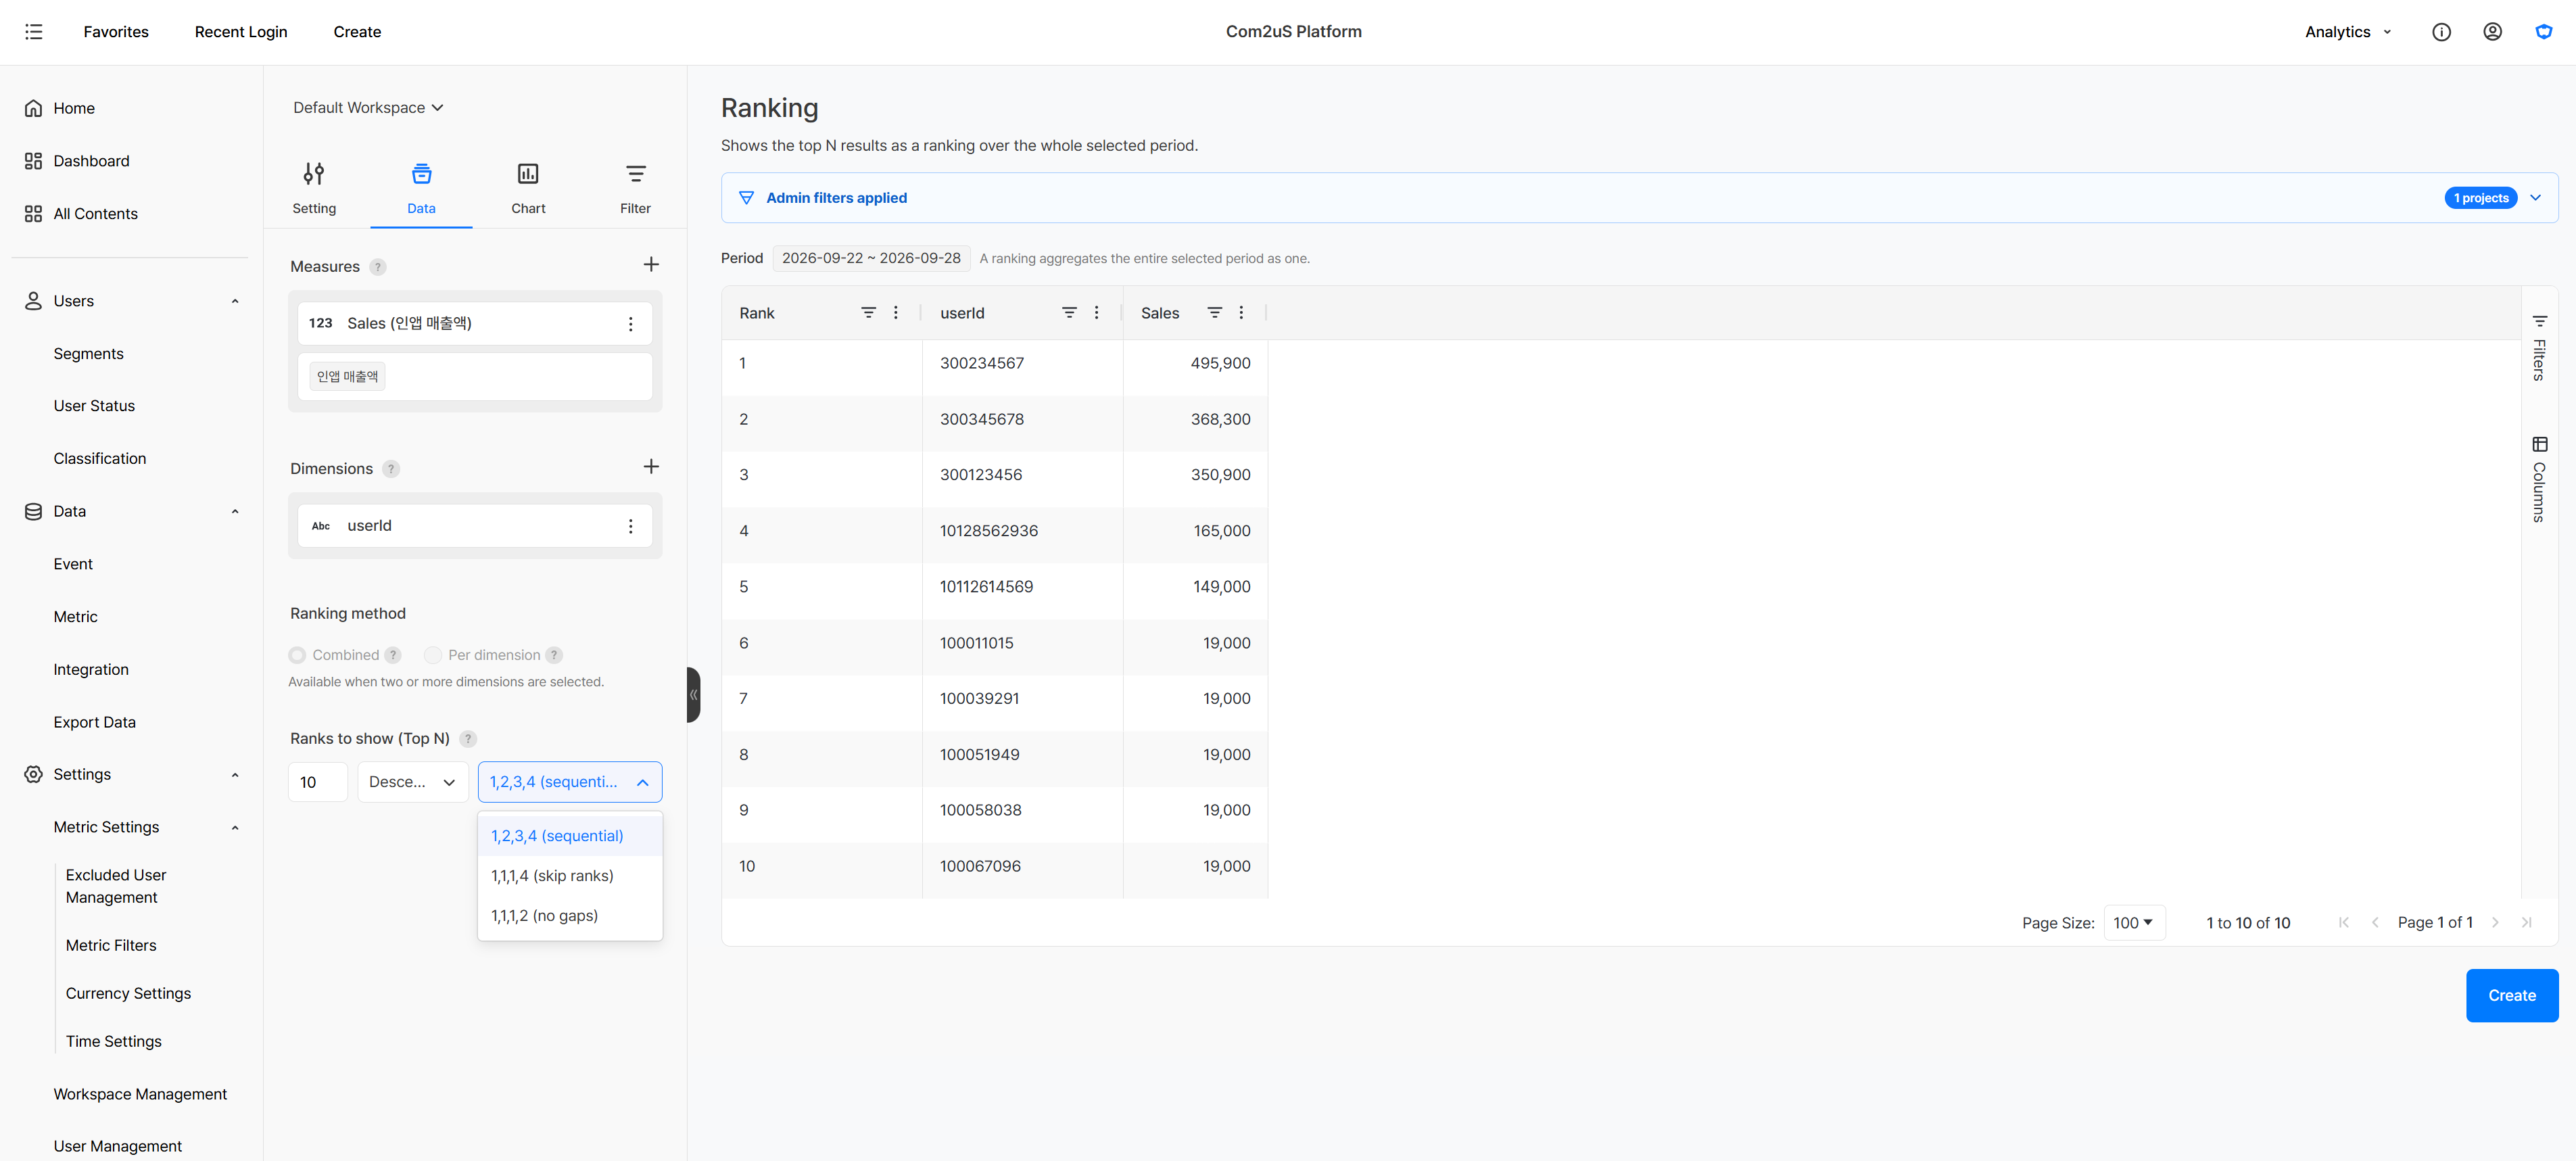
- Sequential: Assigns ranks in order like
1, 2, 3, 4, regardless of ties. - Skip ranks: Skips the ranks after a tie, as in
1, 1, 1, 4. - No gaps: Continues with the next rank after a tie, as in
1, 1, 1, 2.
Checking Top Revenue Metrics
We'll first check the revenue ranking across all players, then split it by market, and finally look at a product ranking by number of sales.
Finding the Top 100 Players by Revenue
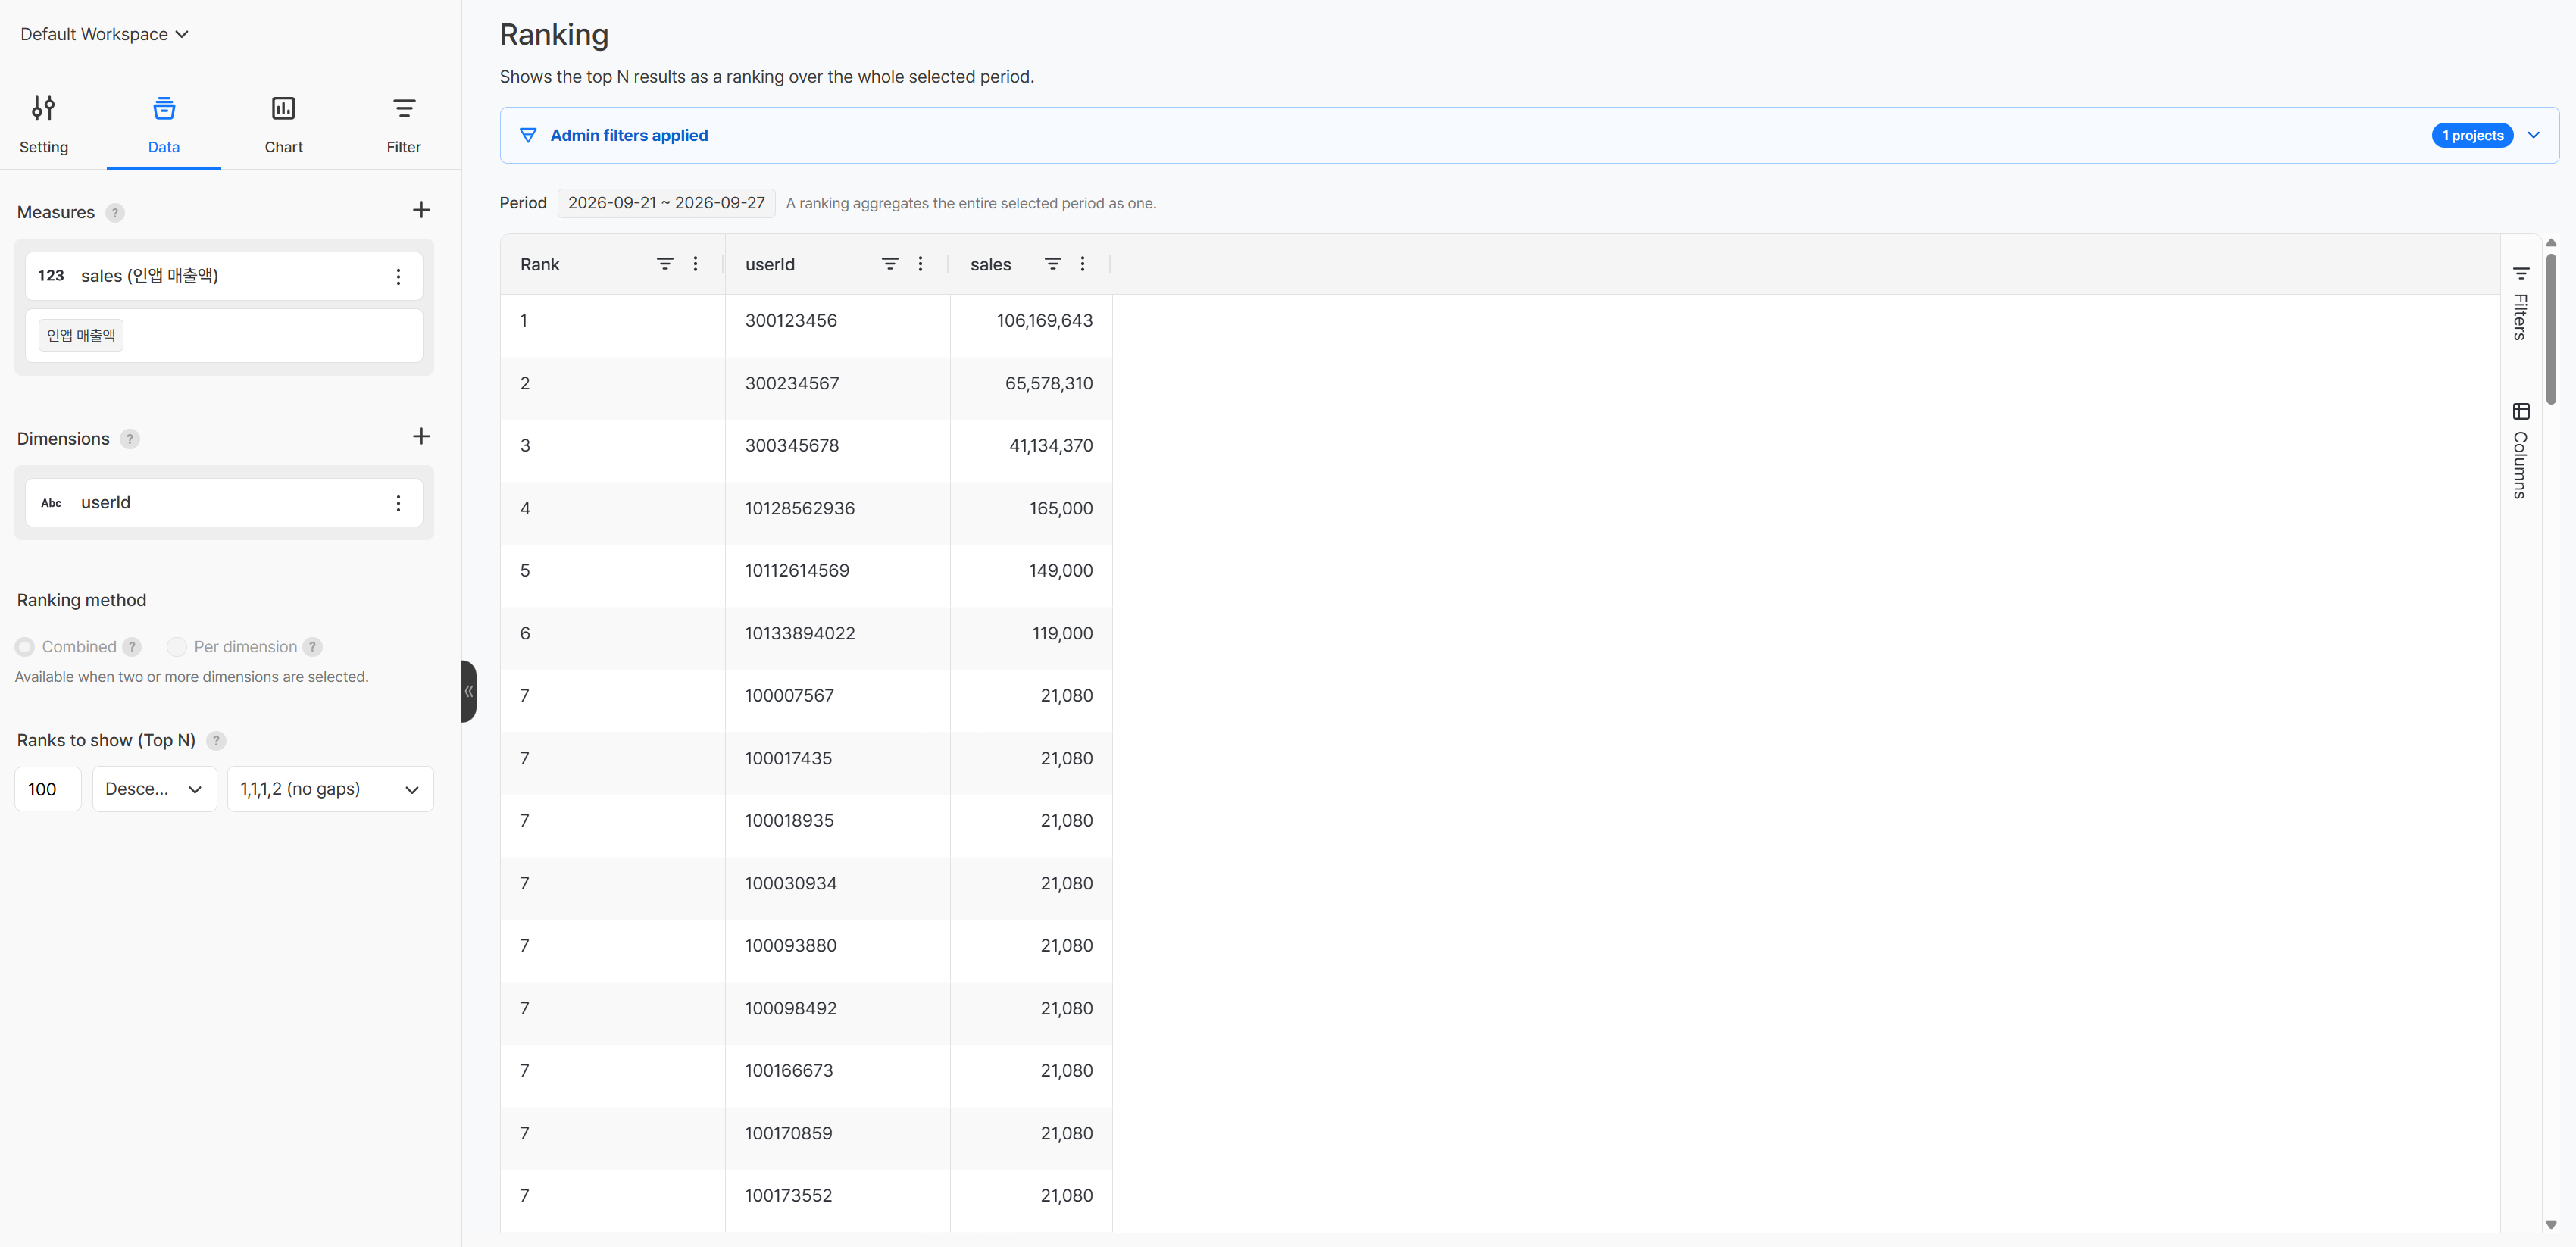
A per-player revenue ranking lets you look at the players who generated high revenue during the period, down to whatever depth you need. The screen below is an example with revenue as the measure and userId as the dimension, sorted in descending order.
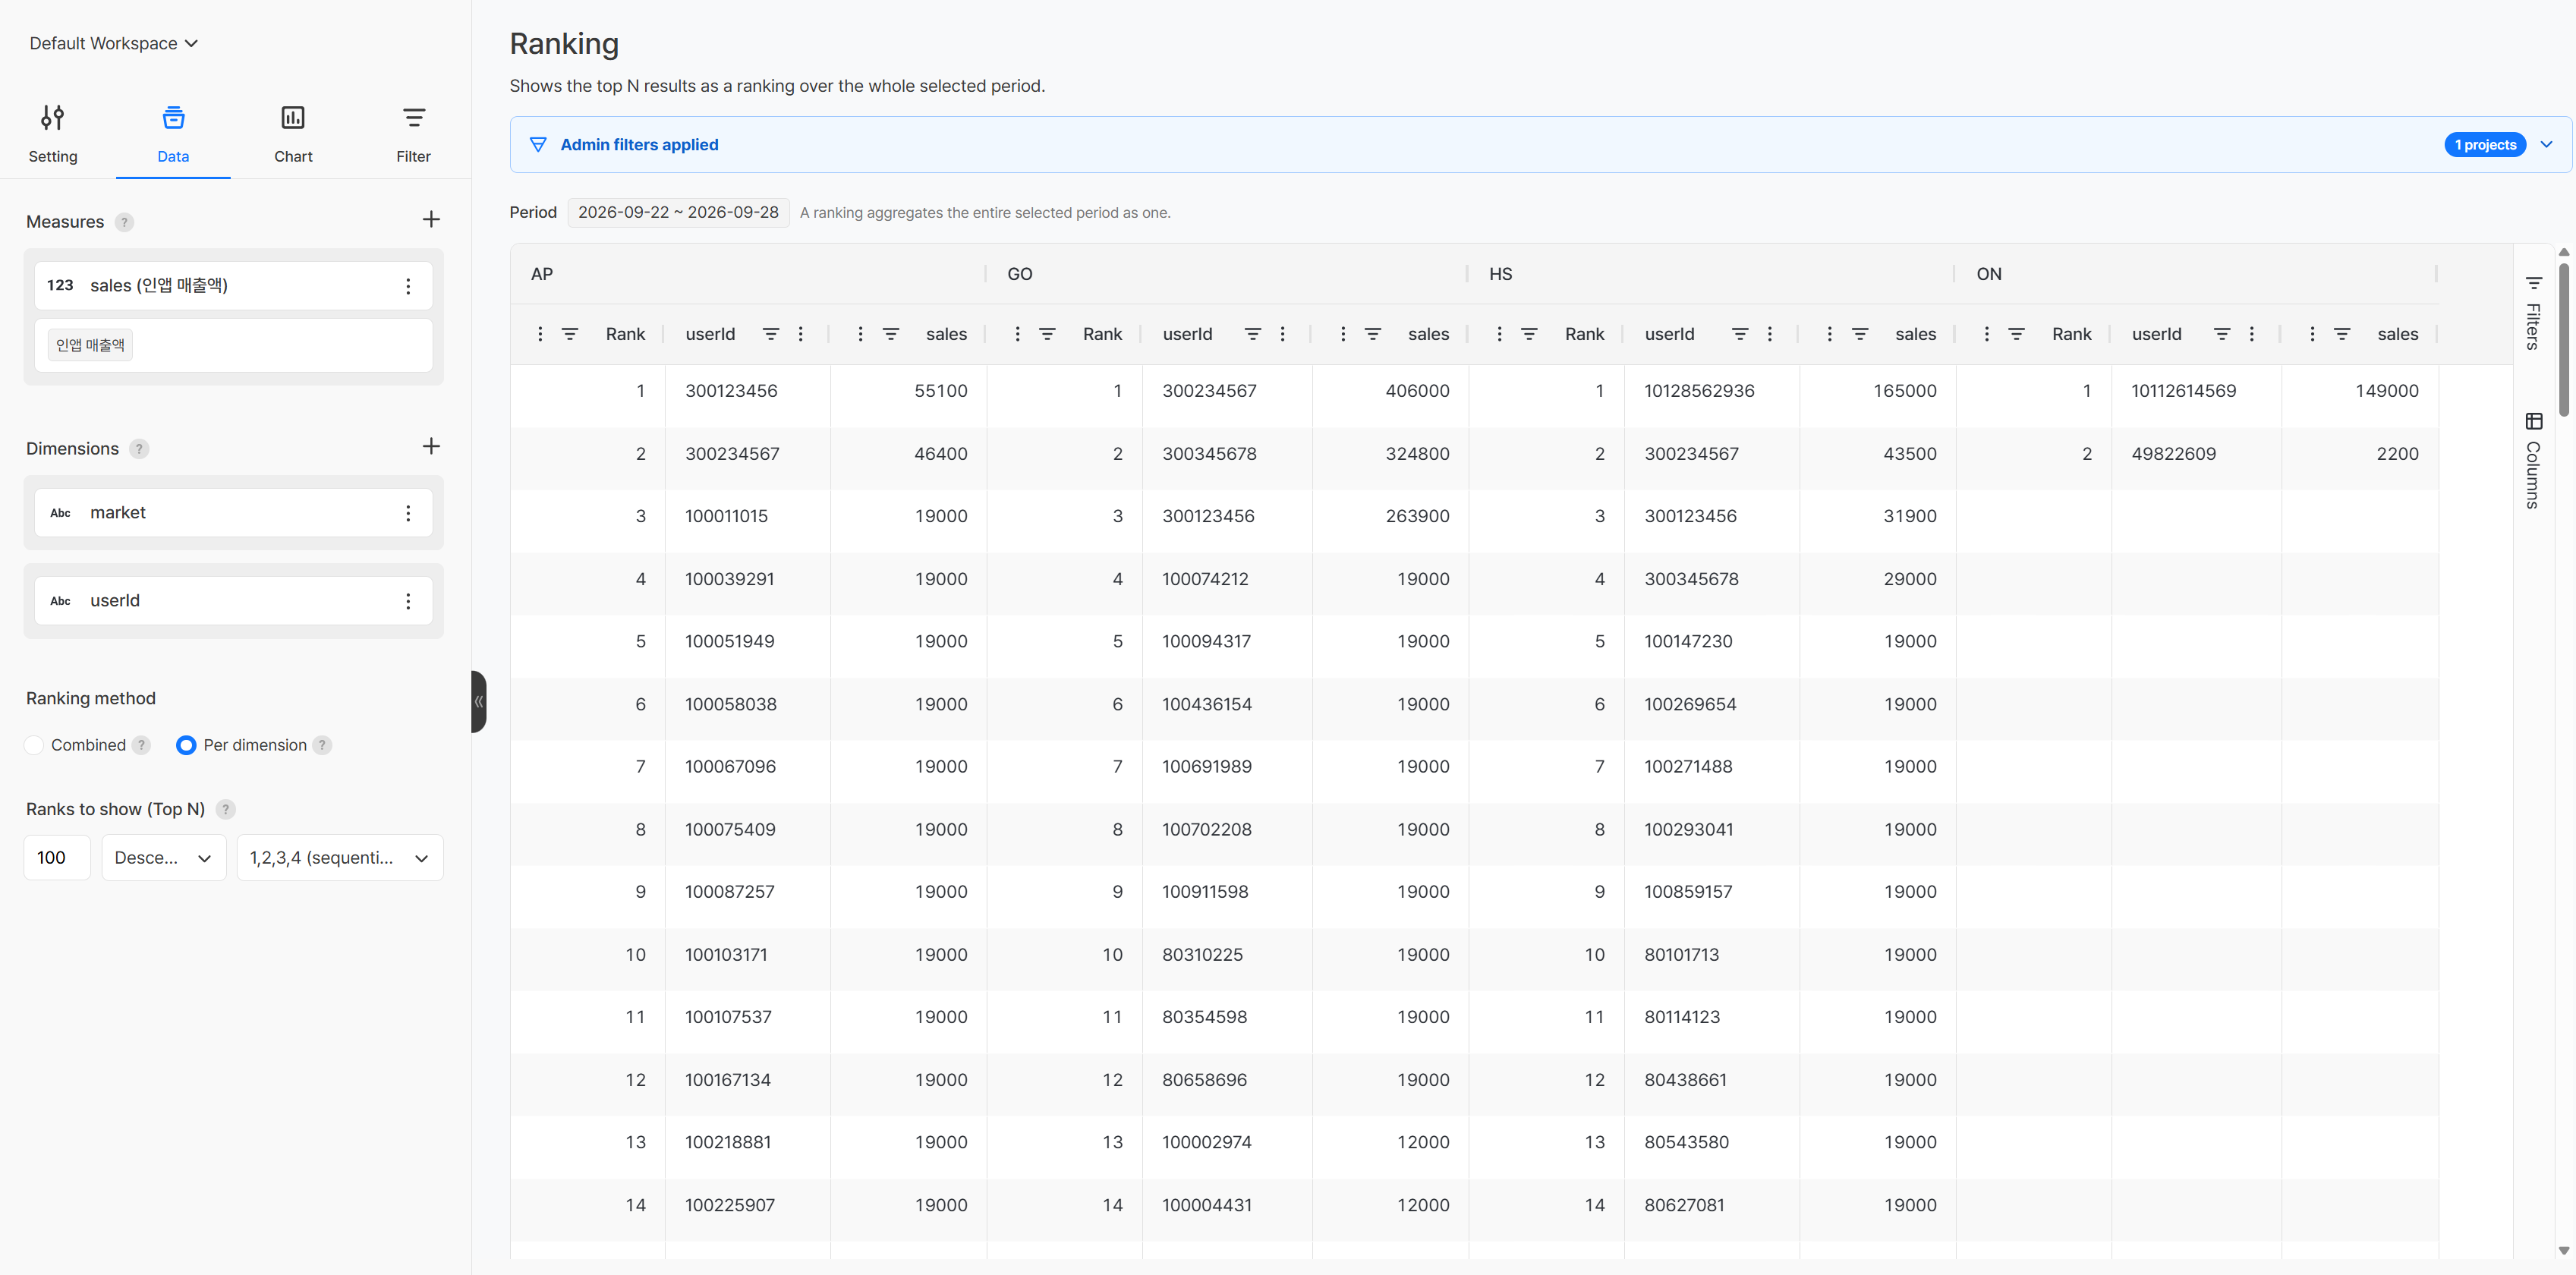
If you then set market and userId as dimensions in that order and choose Per dimension as the ranking method, the overall player revenue ranking is broken down by market, showing each market's player revenue ranking.
Finding the Top 10 Products by Number of Sales
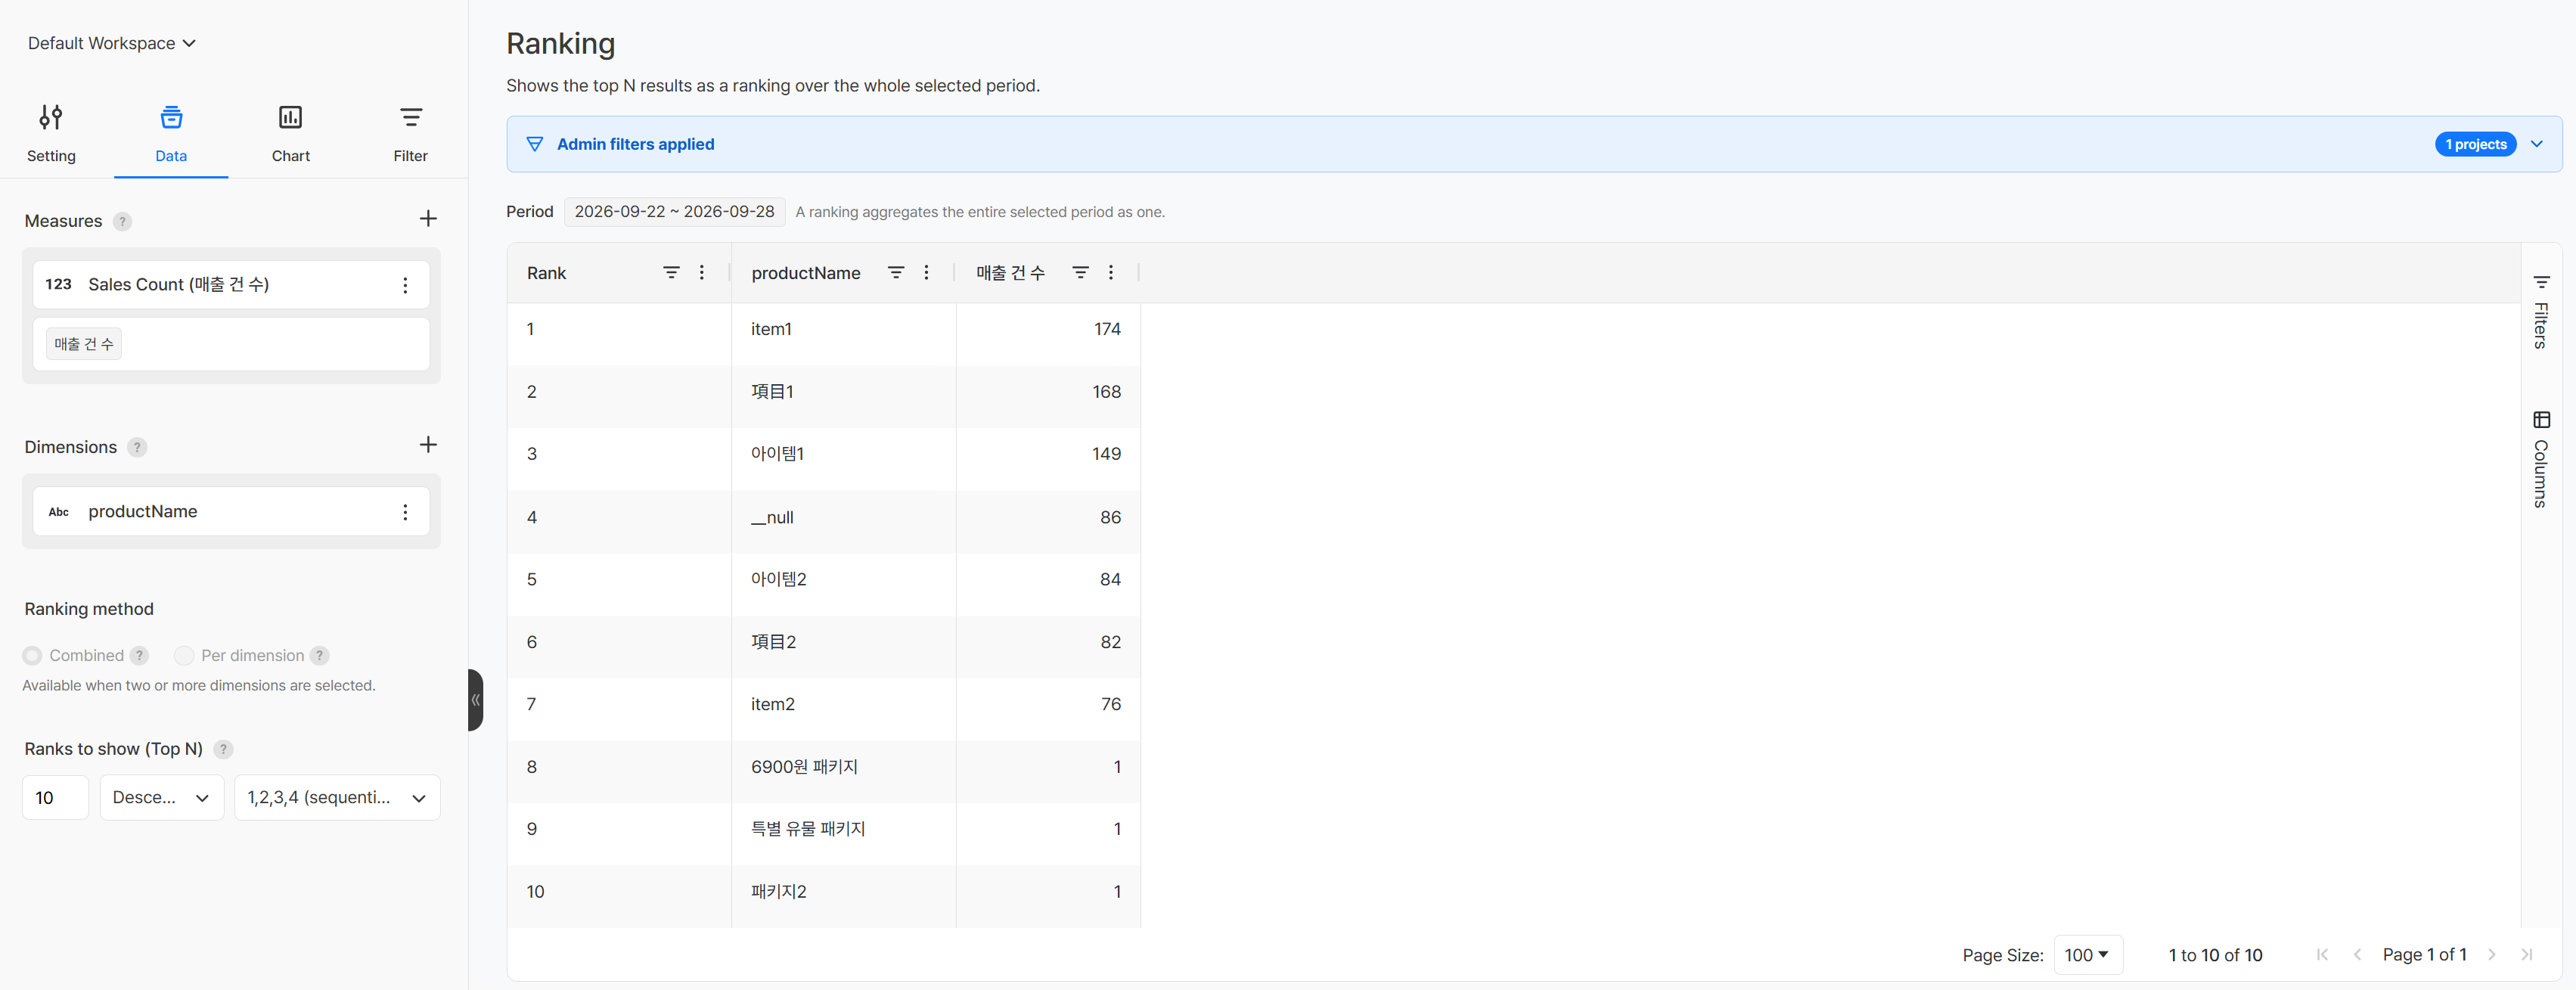
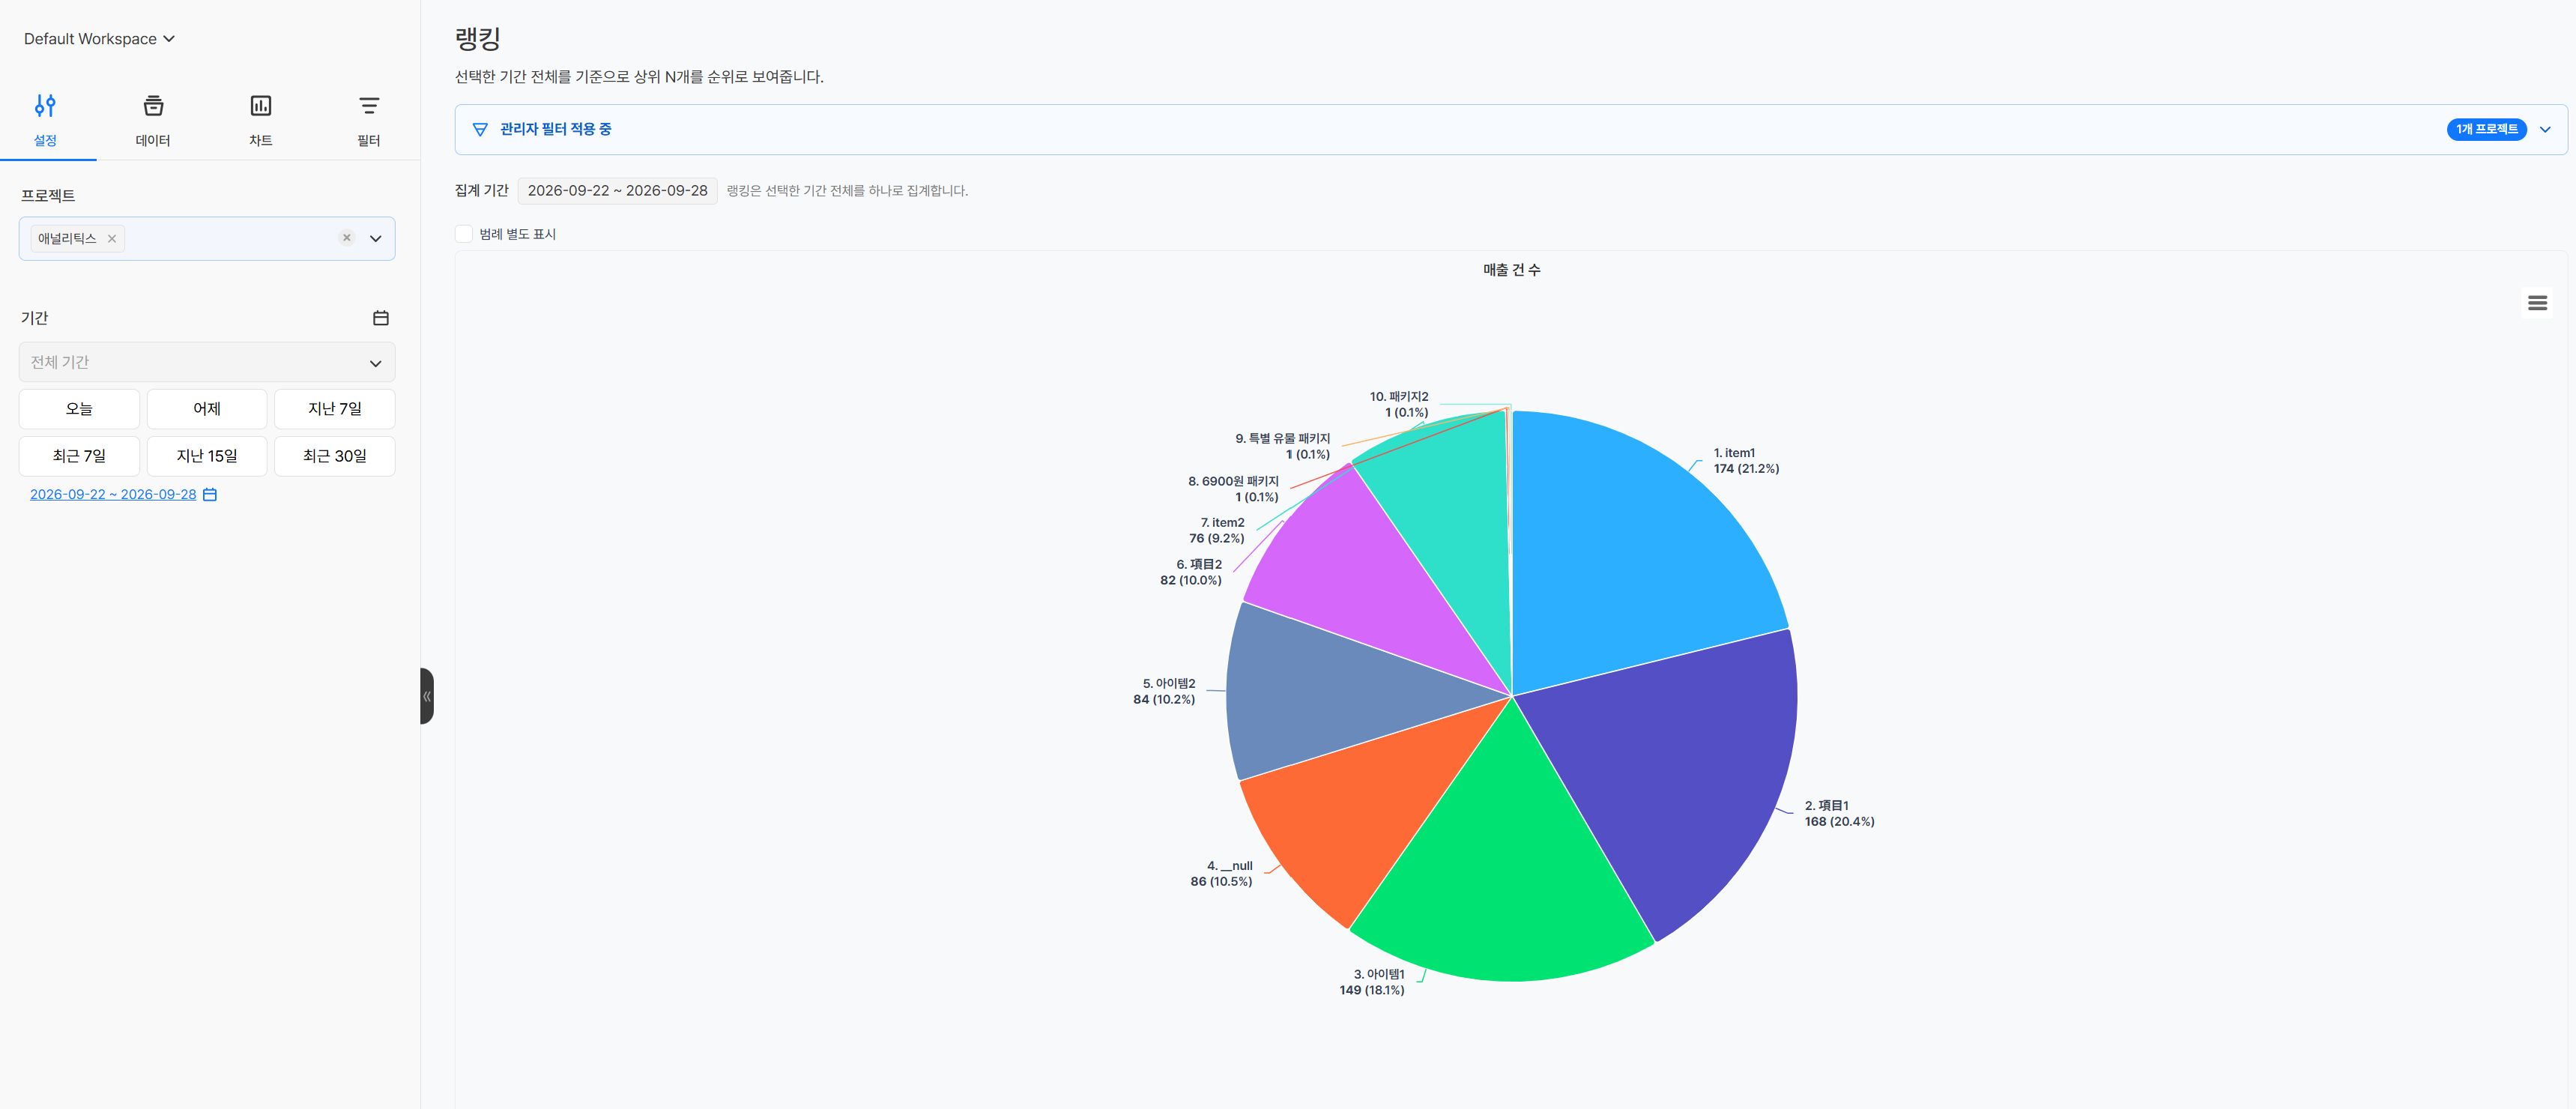
Set number of sales as the measure and product name as the dimension, then choose descending order to see the product ranking over the entire period. If you also select a pie chart as the chart type, you can compare each top 10 product's share of sales at a glance.
A product ranking can serve as a starting point for deciding which products' purchase status to check first, or for narrowing down which items to examine later together with country, market, and player characteristics.
Get Started With Hive Analytics
With Ranking, you can check player and product ranks based on data from a selected period, and break them down across all data or per dimension as needed.
Hive Analytics is a game-focused analytics solution that aggregates game data collected through the Hive SDK by measures and dimensions, letting you analyze the ranks of key targets such as players and products. Try Hive Analytics Ranking now to view your game revenue data as rankings from different angles.