Summarizing Key Dashboard Changes in Natural Language: Using Hive Axyl Plugin, Part 3
With Hive Axyl Plugin installed in ChatGPT, you can summarize dashboards saved in Hive Analytics in natural language and see the key changes and main contributors across multiple charts at once. The summary is based on the metrics, dimensions, periods, and filters of the charts in the dashboard, and you can narrow the scope with follow-up questions that specify a country, market, or product. Changes concentrated on specific dates, such as high-value purchases, should be checked over a longer period to see whether they form a recurring pattern.
Quickly Finding Key Changes Across Multiple Charts
In “Building Charts and Dashboards in Natural Language: Using Hive Axyl Plugin, Part 2”, we saved analysis conditions as charts and combined multiple charts into a single dashboard. This article looks at how to summarize a saved dashboard in natural language and quickly check important changes.
A dashboard shows related metrics such as revenue, the number of paying users, and average revenue per paying user, together with results by country, market, and product. Comparing values based on each chart’s period and filters lets you examine the flow of changes in detail, but as the number of charts grows, it takes longer to combine the results and find the important changes and main contributors.
Data analysts can then request a dashboard summary in natural language to compare the results of multiple charts at once and quickly identify which metrics and major changes to check first. This reduces the need to check and interpret each chart on the dashboard every time, making repetitive monitoring work more efficient.
Natural Language Dashboard Summaries in Hive Analytics
With Hive Axyl Plugin installed in ChatGPT, you can select a dashboard saved in Hive Analytics and summarize key changes based on the metrics, dimensions, periods, and filters of the charts it contains. Rather than only reading the screen image, it compares results based on the analysis conditions set for each chart and the query results.
- Select a dashboard: Specify the dashboard to summarize and the project.
- Check the analysis criteria: Check the query period, comparison period, filters, and currency.
- Summarize key changes: Organize the overall metrics and the segments with large changes by country, market, and product.
- Ask follow-up questions: Continue the analysis by narrowing the scope, for example to a specific country or product.
Note
For how to install the plugin and set up MCP members for your organization, see “Querying Game Metrics and Checking Changes in Natural Language: Using Hive Axyl Plugin, Part 1”.
Summarizing the US and Japan Product ARPPU Dashboard
Using the US and Japan product ARPPU decline analysis dashboard built in Part 2, we summarize the key metrics and the changes by country, market, and product in natural language, based on the period and filters set in the dashboard.
Requesting a Dashboard Summary
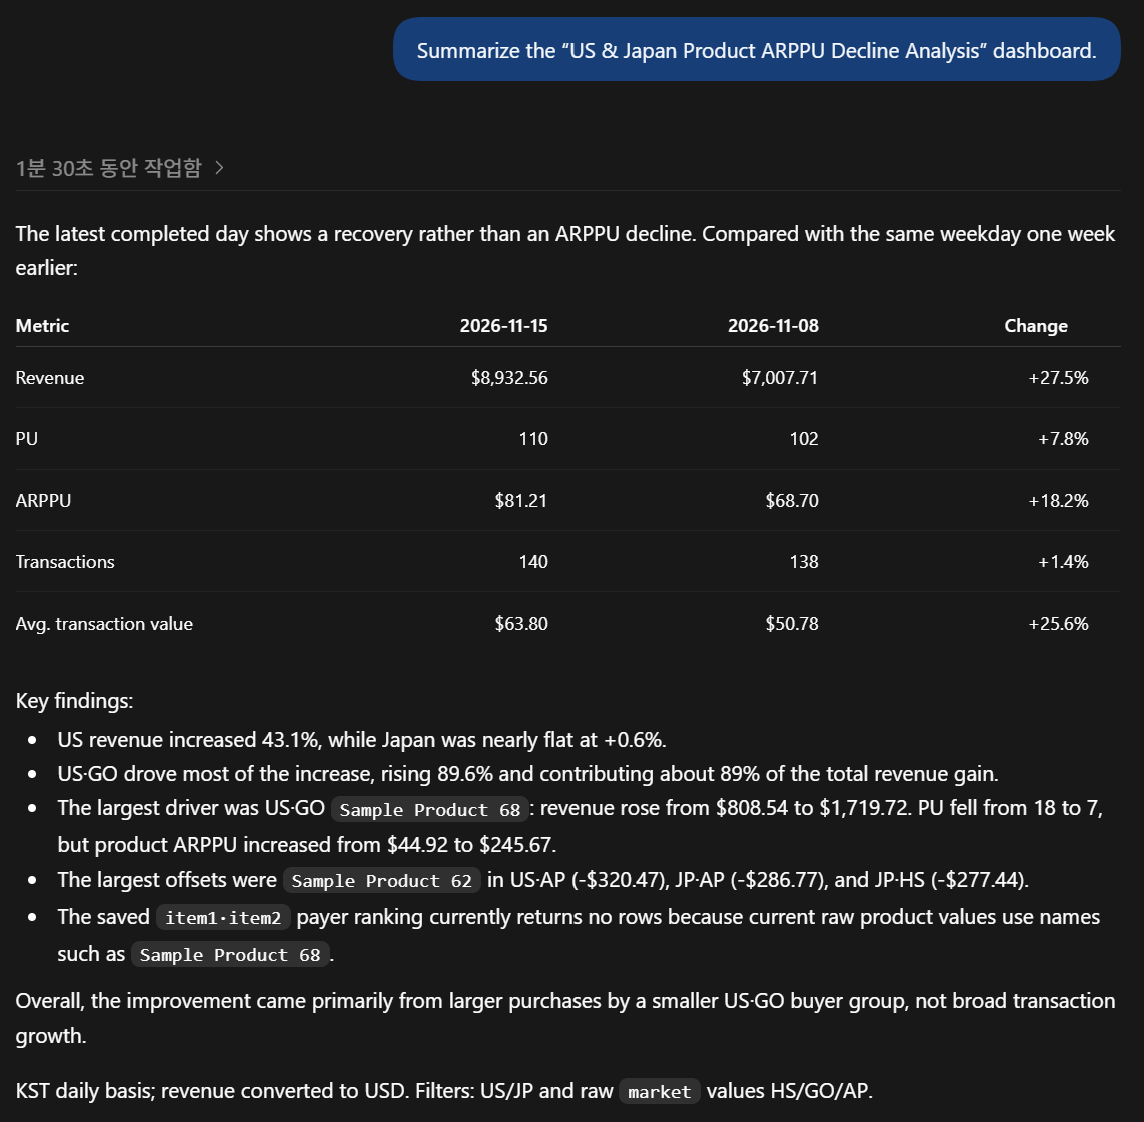
Summarize the “US & Japan Product ARPPU Decline Analysis” dashboard.
The summary showed that compared with the same day of the previous week, revenue increased by 27.5%, the number of paying users by 7.8%, and ARPPU by 18.2%. Growth was especially large in the United States and the GO market, and high-value purchases of Sample Product 68 in US·GO contributed most to the rise in revenue and ARPPU. In actual analysis, check the period and filters applied to the summary and, if needed, ask additional questions that specify a country, market, or product.
Checking Recent Revenue Patterns in US·GO
If the overall summary shows the United States and the GO market as the main growth areas, you can use follow-up questions to check the recent revenue trend and whether changes recur on specific days of the week.
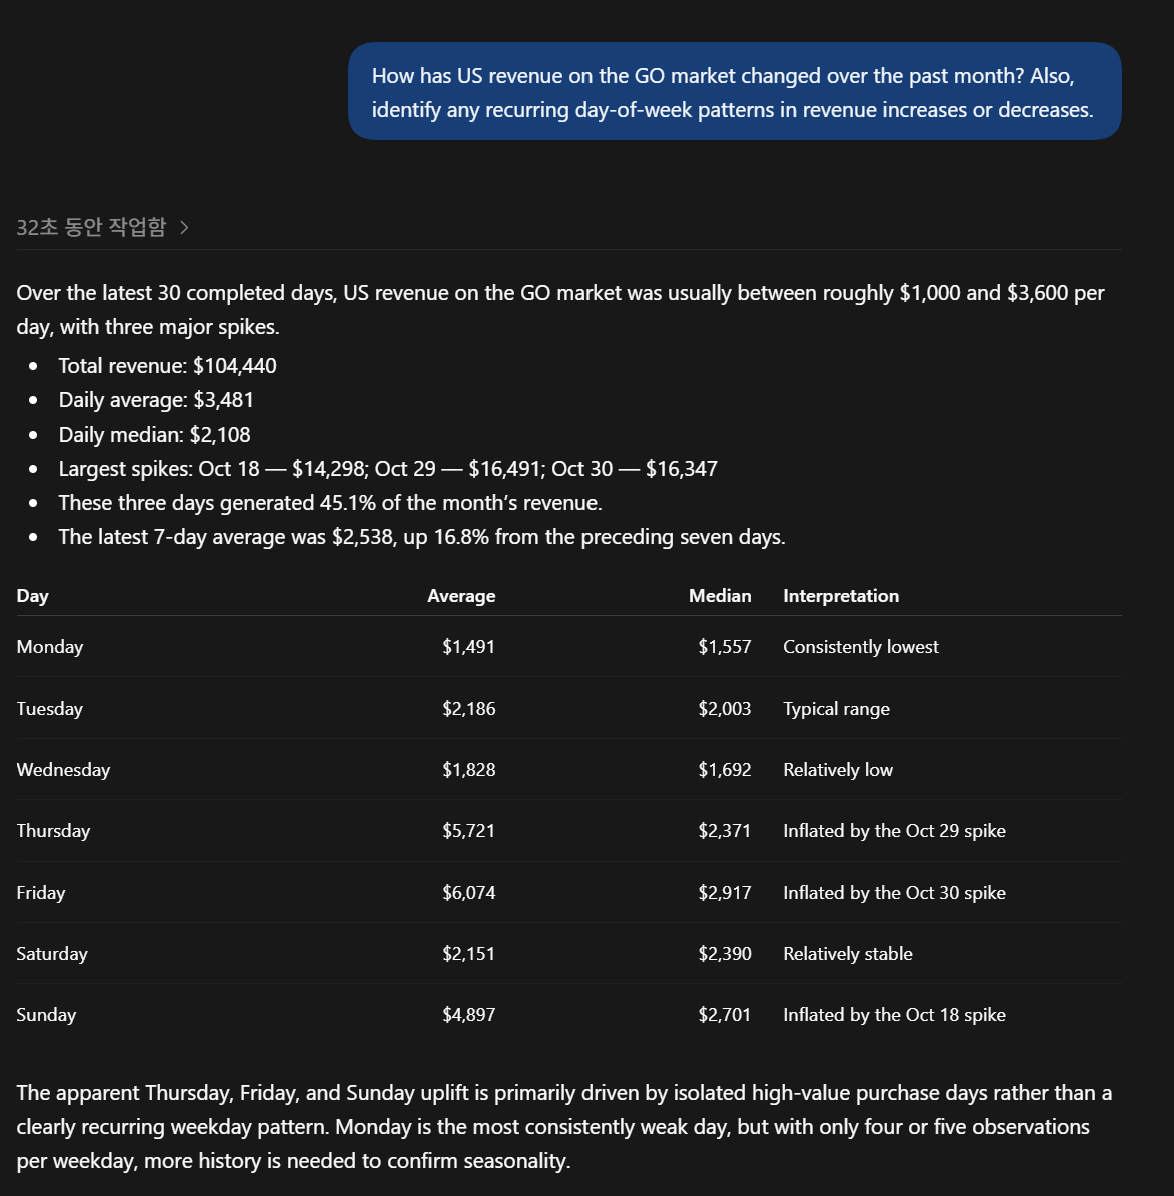
How has US revenue on the GO market changed over the past month? Also, identify any recurring day-of-week patterns in revenue increases or decreases.
The analysis showed that over the last 30 days, US·GO revenue was mostly around $1,000 to $3,600 per day, but rose sharply on October 18, 29, and 30 due to high-value purchases. Average revenue was higher on Thursdays, Fridays, and Sundays, but because specific dates had a large impact, more observation is needed before treating it as a recurring day-of-week pattern.
If the dashboard summary reveals a meaningful user group, you can go on to check that group’s repeated behavior. “Checking Segment Purchase Retention in Natural Language: Using Hive Axyl Plugin, Part 4” covers how to create segments and build purchase retention in natural language.
Getting Started with Hive Analytics
With Hive Axyl Plugin, you can summarize the key changes and contributors in a dashboard made up of multiple charts in natural language, and refine the scope of analysis with follow-up questions.
Hive Analytics is an analytics solution built for games that lets you analyze game metrics based on events collected through the Hive SDK and summarize dashboard changes in natural language. Install Hive Axyl Plugin in ChatGPT now and quickly review the key changes in your Hive Analytics dashboards.