Checking Game Operations Status on the Go
On Hive Analytics Mobile, you can view the same dashboards you built on PC, change the date range and filters, and check KPIs such as Active Users (AU), New Users (NU), Paying Users (PU), and sales along with their day-over-day change rates. Use it for the situations that come up most often when you're away from your desk: checking live events, sharing status with leadership, spotting anomalies, and comparing trends over time.
Game operations doesn't stop when you leave the office
Right after a new launch, a major update, or a seasonal event, you need to keep a close eye on core flows like user acquisition and payments. But the person responsible isn't always at a desk.
Whether you're commuting or traveling, you still need to check on service health and decide how to respond, so you need a way to view key KPIs regardless of place or time.
Information that fits the situation
Managers check every day whether core metrics such as DAU, revenue, sessions, and retention are within the normal range. Right after an event or update, they also check whether the change is behaving as intended and whether anything looks different from usual.
When something unusual happens, identifying when it started and how far it spread is what allows a fast response.
The dashboards you already use, now on mobile
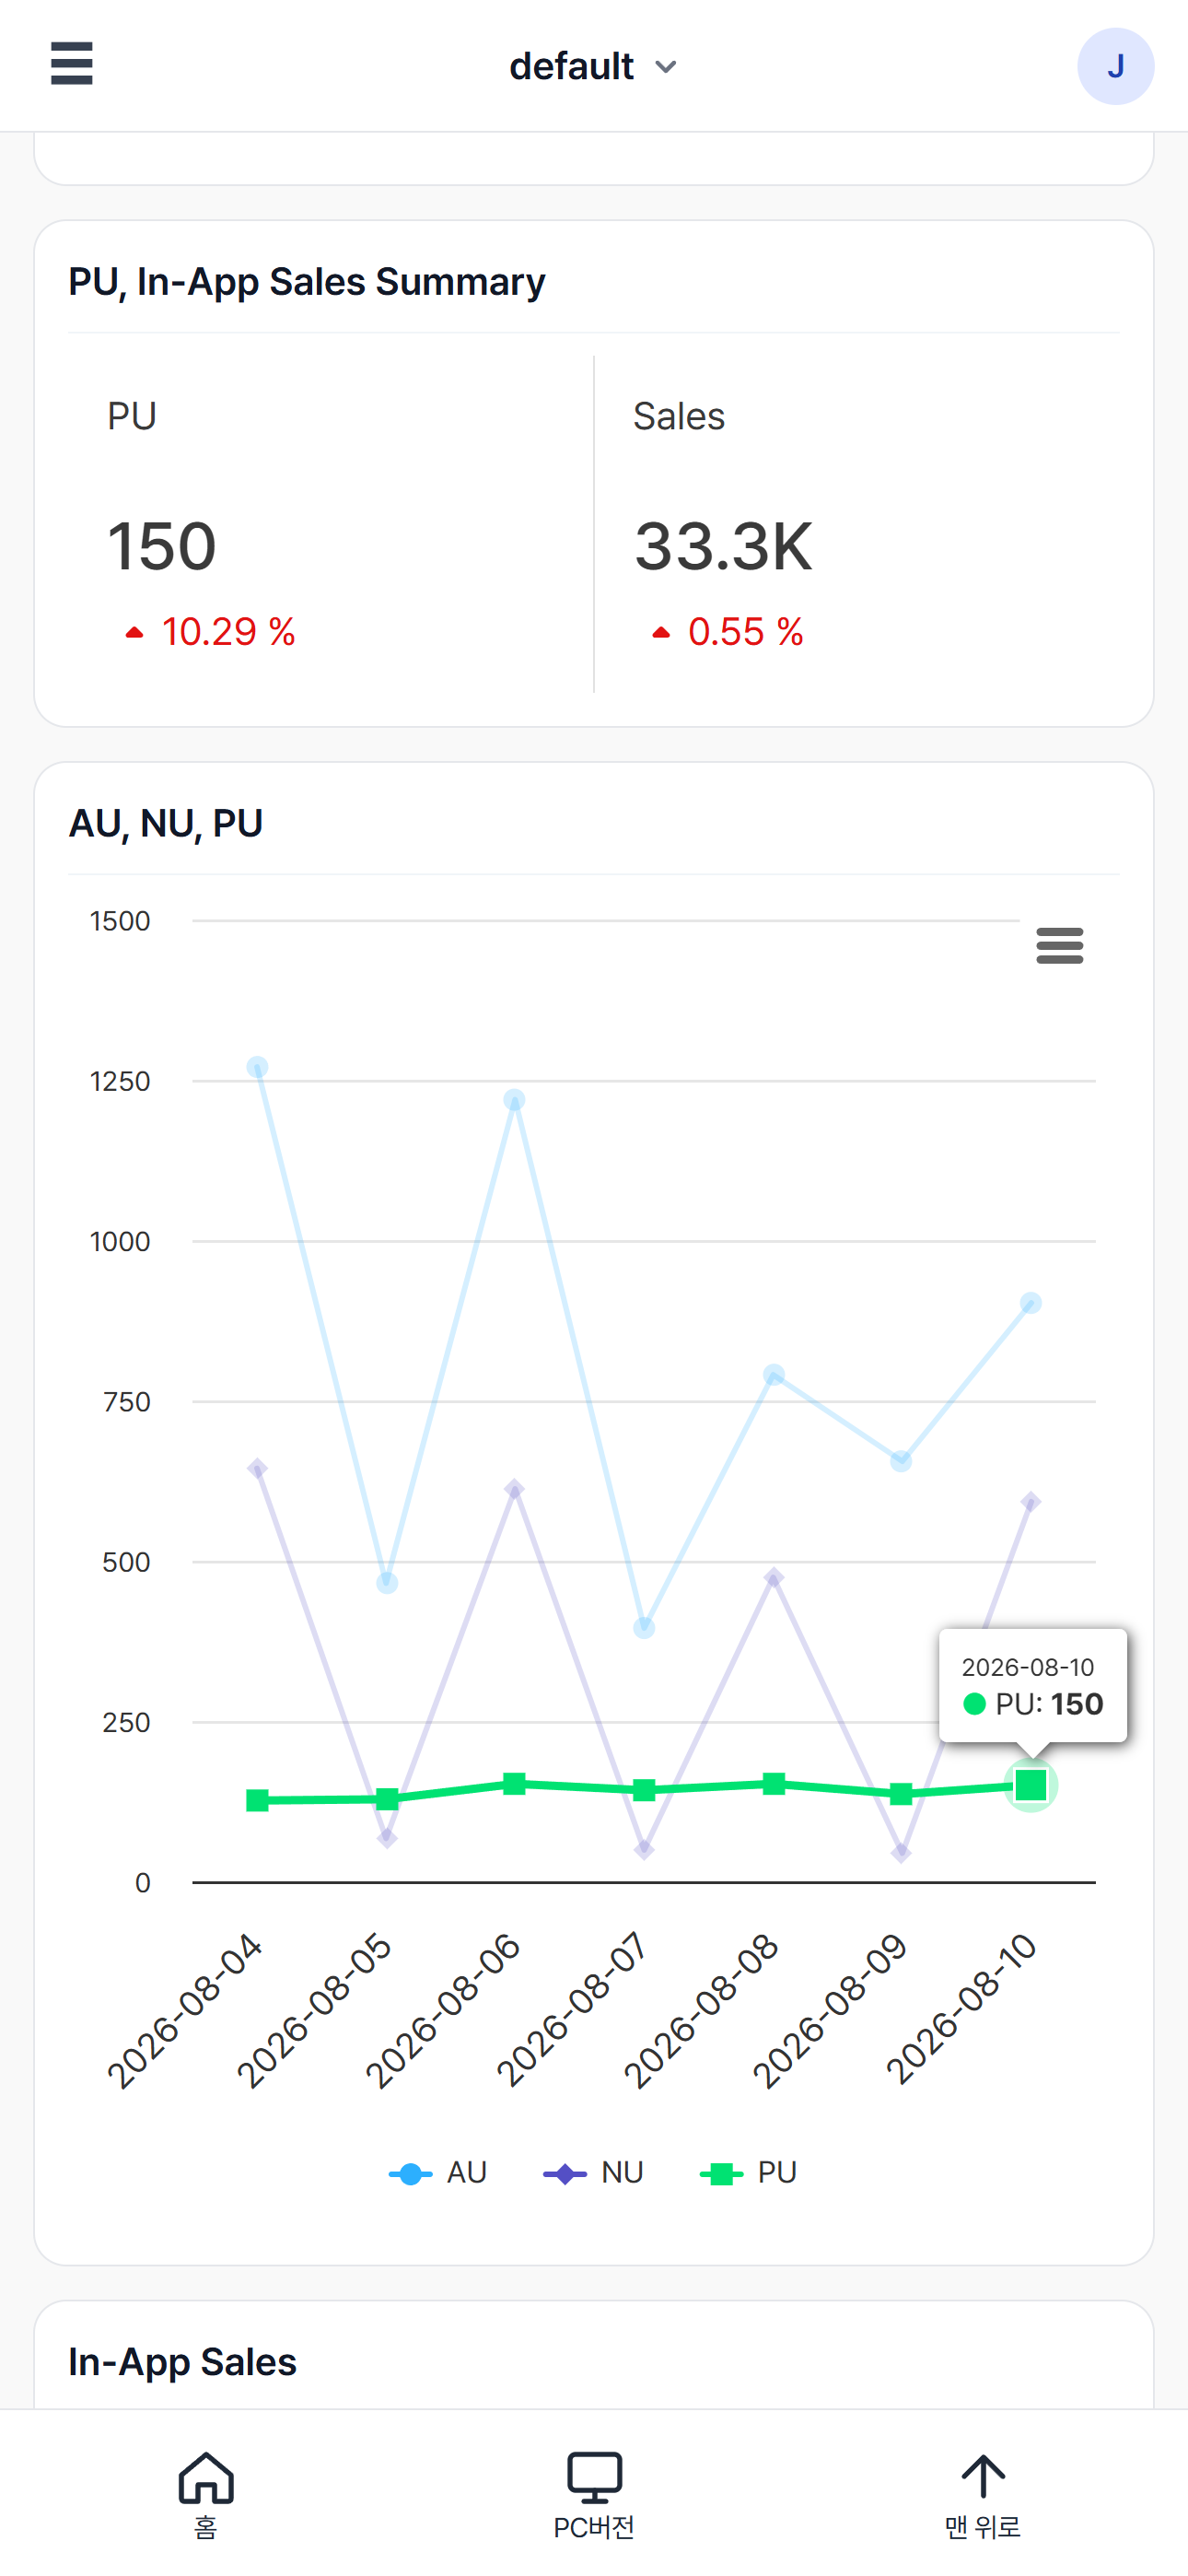
Once you log in to Hive Analytics Mobile, every dashboard you built on PC is available in the same layout on mobile. You can change the date range to daily, weekly, or monthly, apply various filters, and check operations under whatever conditions you need — even on the go.
Mobile use cases
Checking on a live event
When a seasonal event or a limited-time promotion starts, adjust the period and filters to review login trends, payment activity, and other key figures. Use this to understand user response and review your strategy.
If traffic is lower than expected or payment activity has shifted, share the relevant screen to decide who should follow up, then widen the date range on the same screen to dig deeper into the cause.
Sharing status with leadership
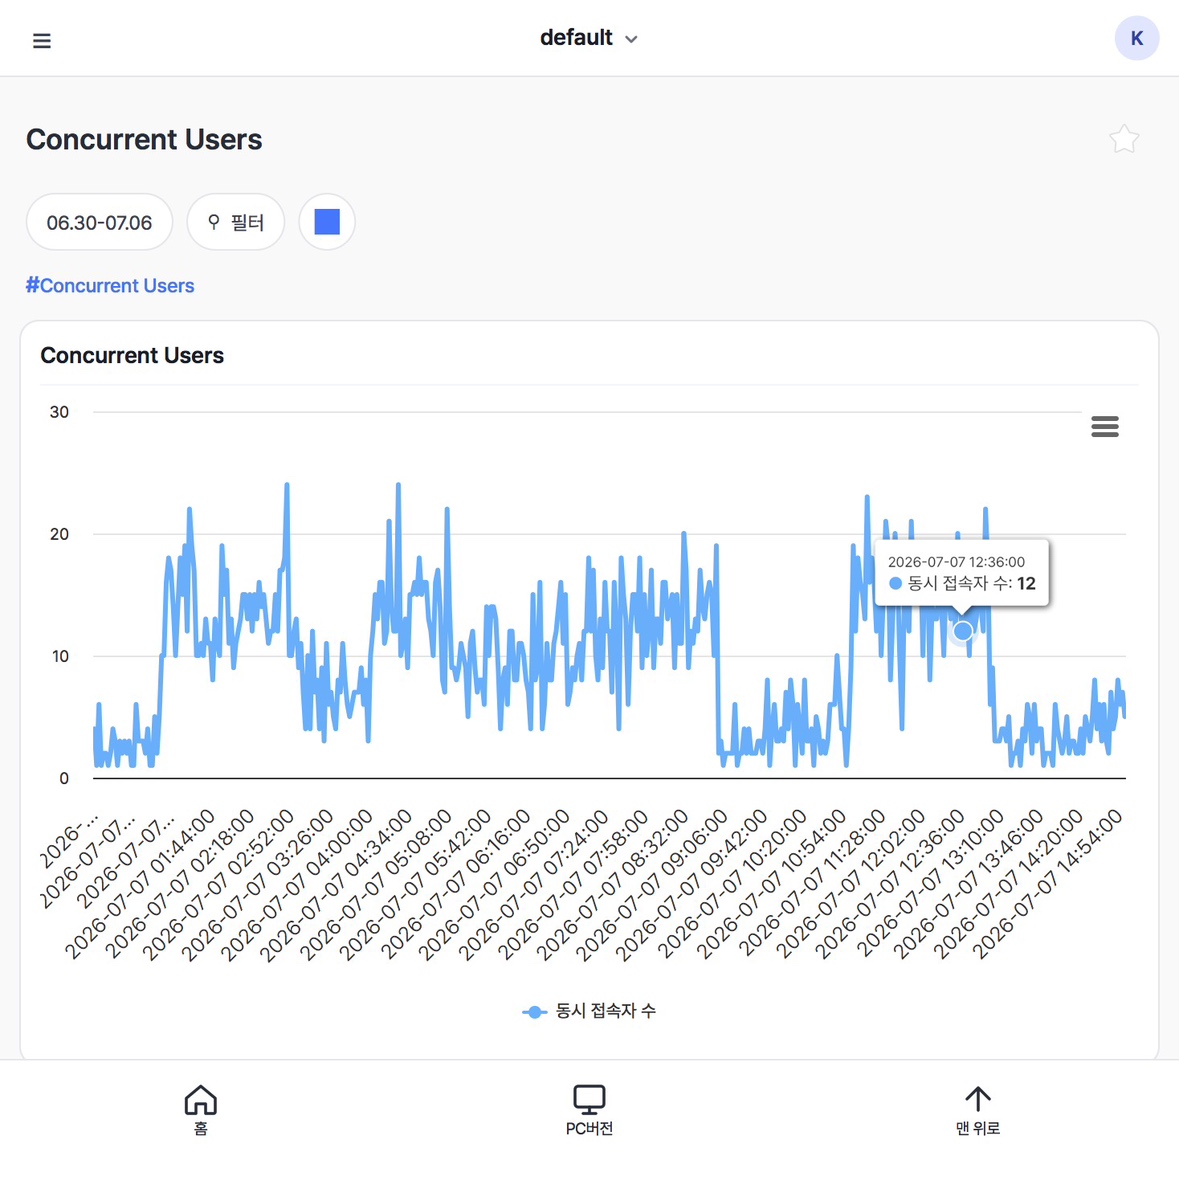
PMs, business leads, and C-level stakeholders can also check key figures before a meeting or while traveling, so they understand service status and can prepare decisions.
Checking the latest figures before a meeting makes it easier to explain the current status without rebuilding materials, and lets you flag major changes in advance for discussion.
Investigating a possible anomaly
Movement in core KPIs reveals when something is behaving differently than usual. If payment amounts or active users drop sharply, share the situation with the relevant team and look into the cause in detail.
Reviewing the overall trend and the size of the change first — before deciding whether to act immediately and moving into deeper analysis — helps shorten the time it takes to share an initial update.
Comparing trends over a period
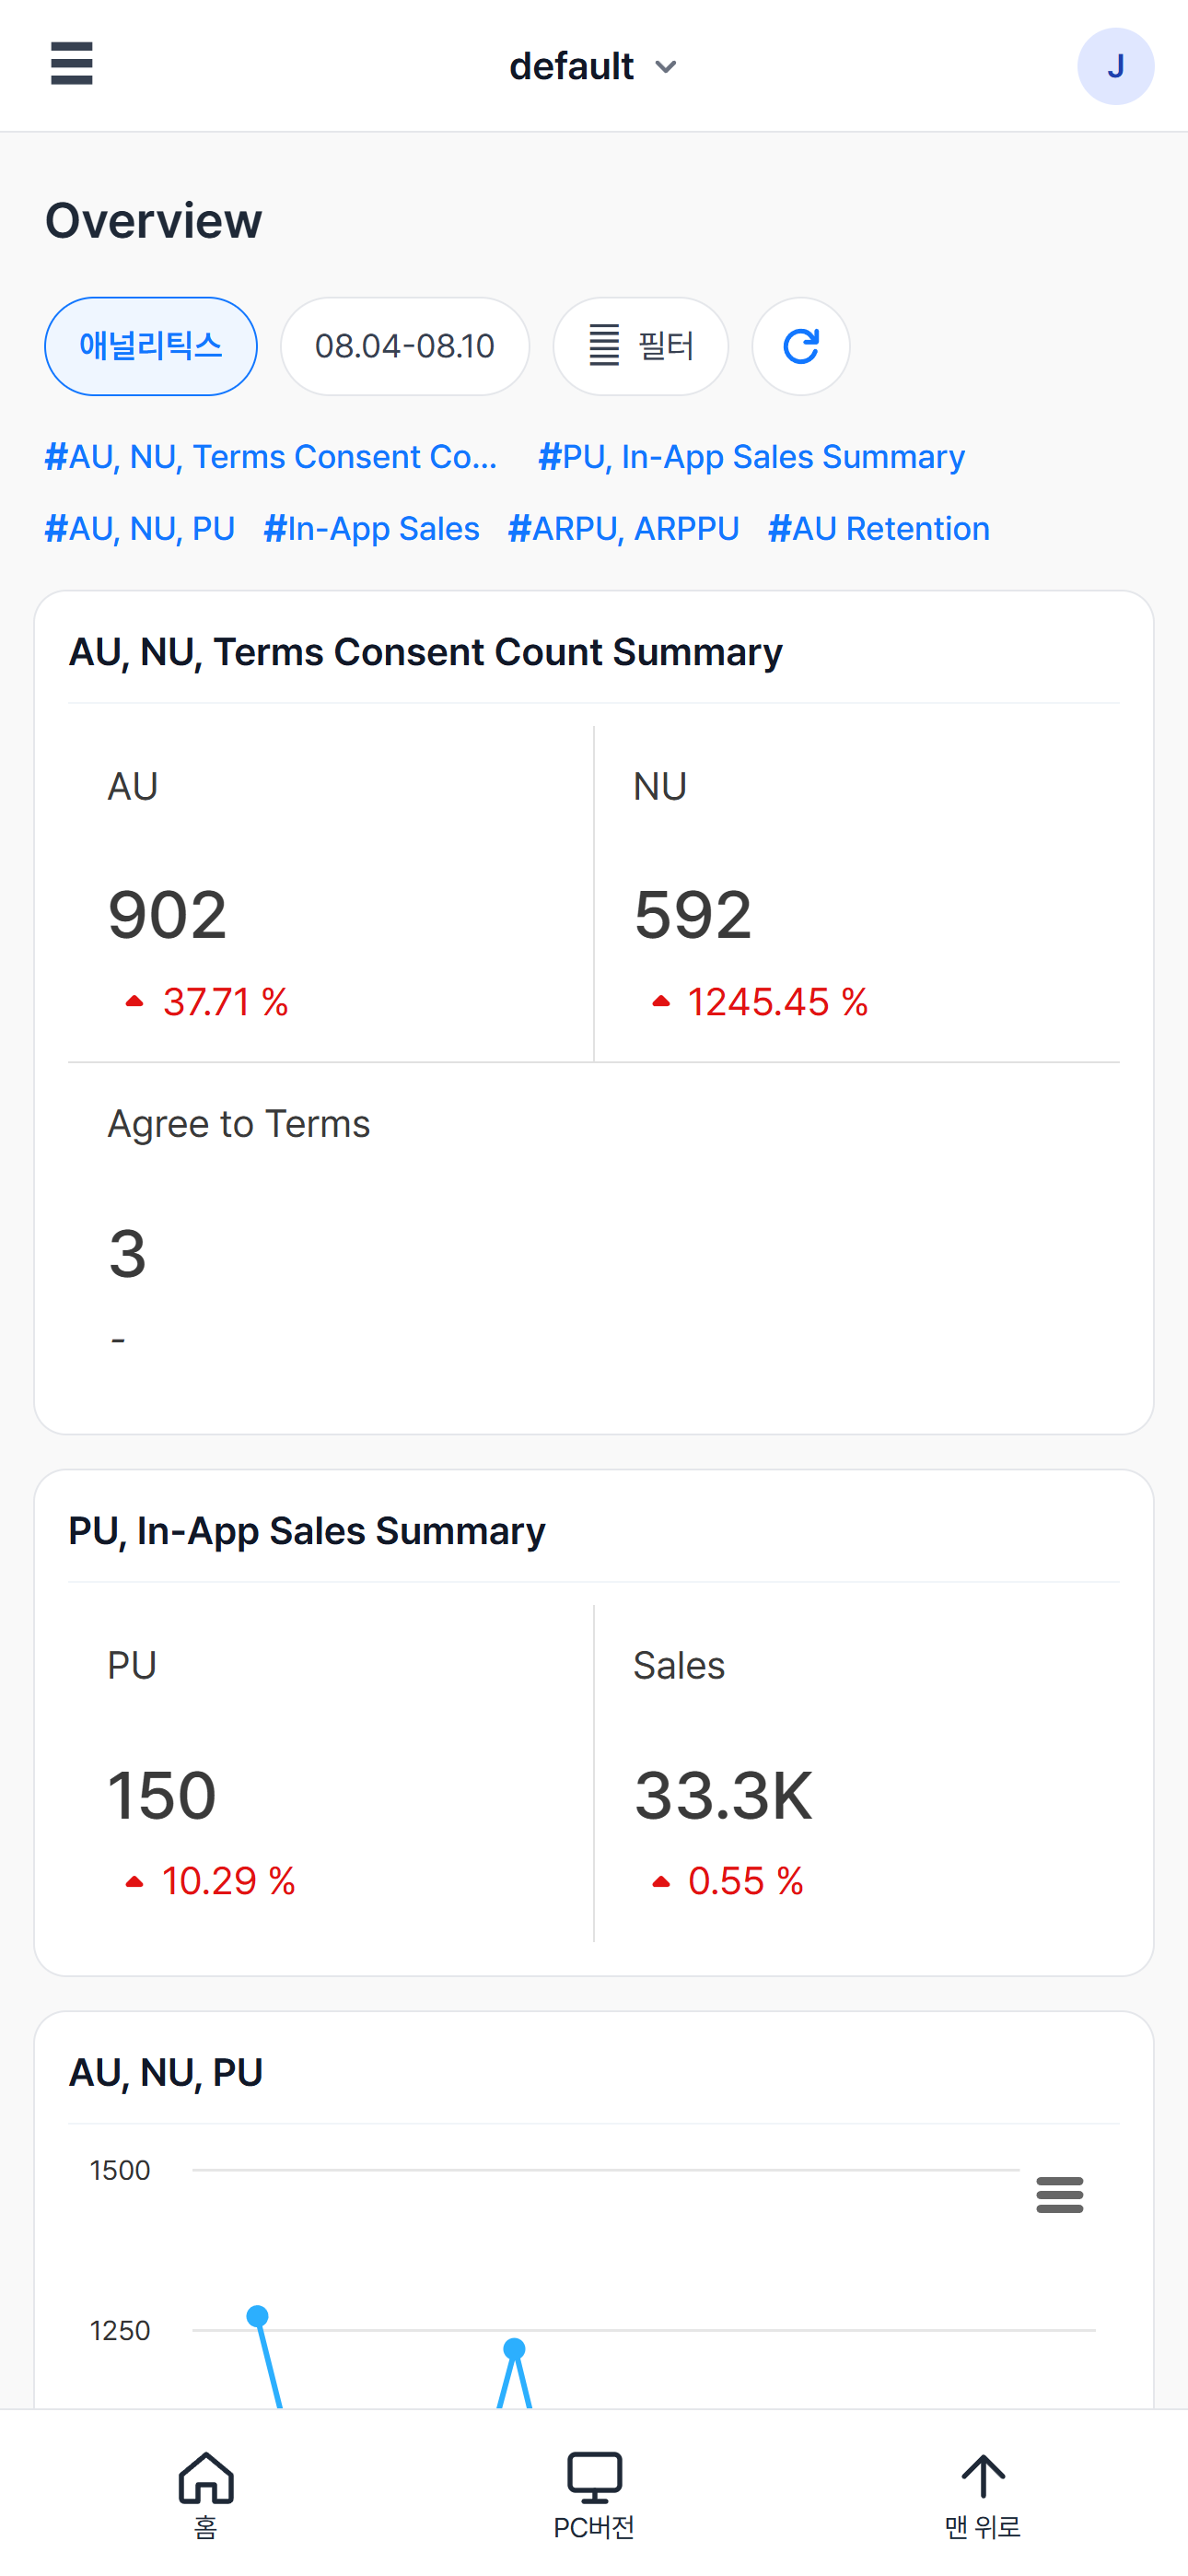
Switch the date range to daily, weekly, or monthly and apply filters to bring the area you care about into focus. Use this to compare this week's KPIs against last week's, or to review monthly payment trends.
Get started with Hive Analytics
In game operations, what matters is spotting changes in service status quickly and following through with the right response.
Hive Analytics automatically collects 60+ standard game events with just a Hive SDK integration. The data it collects can be used on both desktop and mobile, and applying a date range and filters to an existing screen lets you focus on the area you care about.
Start now with Hive Analytics and use the mobile dashboard to check key metrics and anomalies from anywhere, so you're ready for whatever comes next.