Where Data Analysis Starts: Aligning Your Organization's Metric Standards
Even frequently used metrics like active users (AU) and revenue can produce different results for the same period if their calculation criteria differ. With Hive Analytics' Metric feature, you can save a single metric definition that combines events, aggregation methods, and formulas, then reuse it across multiple charts and dashboards. Because updating a Metric automatically updates every screen that uses it, your whole organization can view and discuss data using the same standard.
Same Name, Different Standards
Frequently used metrics such as AU, revenue, and purchase conversion rate can produce different results even when they share the same name, depending on how they are calculated. Depending on which events are used, which filters are applied, and which fields serve as the basis for calculation, the same period can yield different numbers.
When metrics are configured individually for each chart, these discrepancies are hard to notice. If a difference in numbers surfaces during a meeting or a report, teams have to go back and check each metric's calculation criteria before they can even begin interpreting the change in the data.
For an organization to make full use of its data, it needs to manage the definitions and calculation methods of frequently used metrics under a single standard.
Collaboration That Requires Common Metrics
For multiple roles to work with the same metric, the organization first needs a shared standard. When this standard is defined as a Metric, operations and planning staff, marketing, and business teams can all apply the same figures to their own work.
In particular, when the user behaviors and outcomes an organization considers important are managed as Metrics, different stakeholders can interpret and discuss the data from the same perspective.
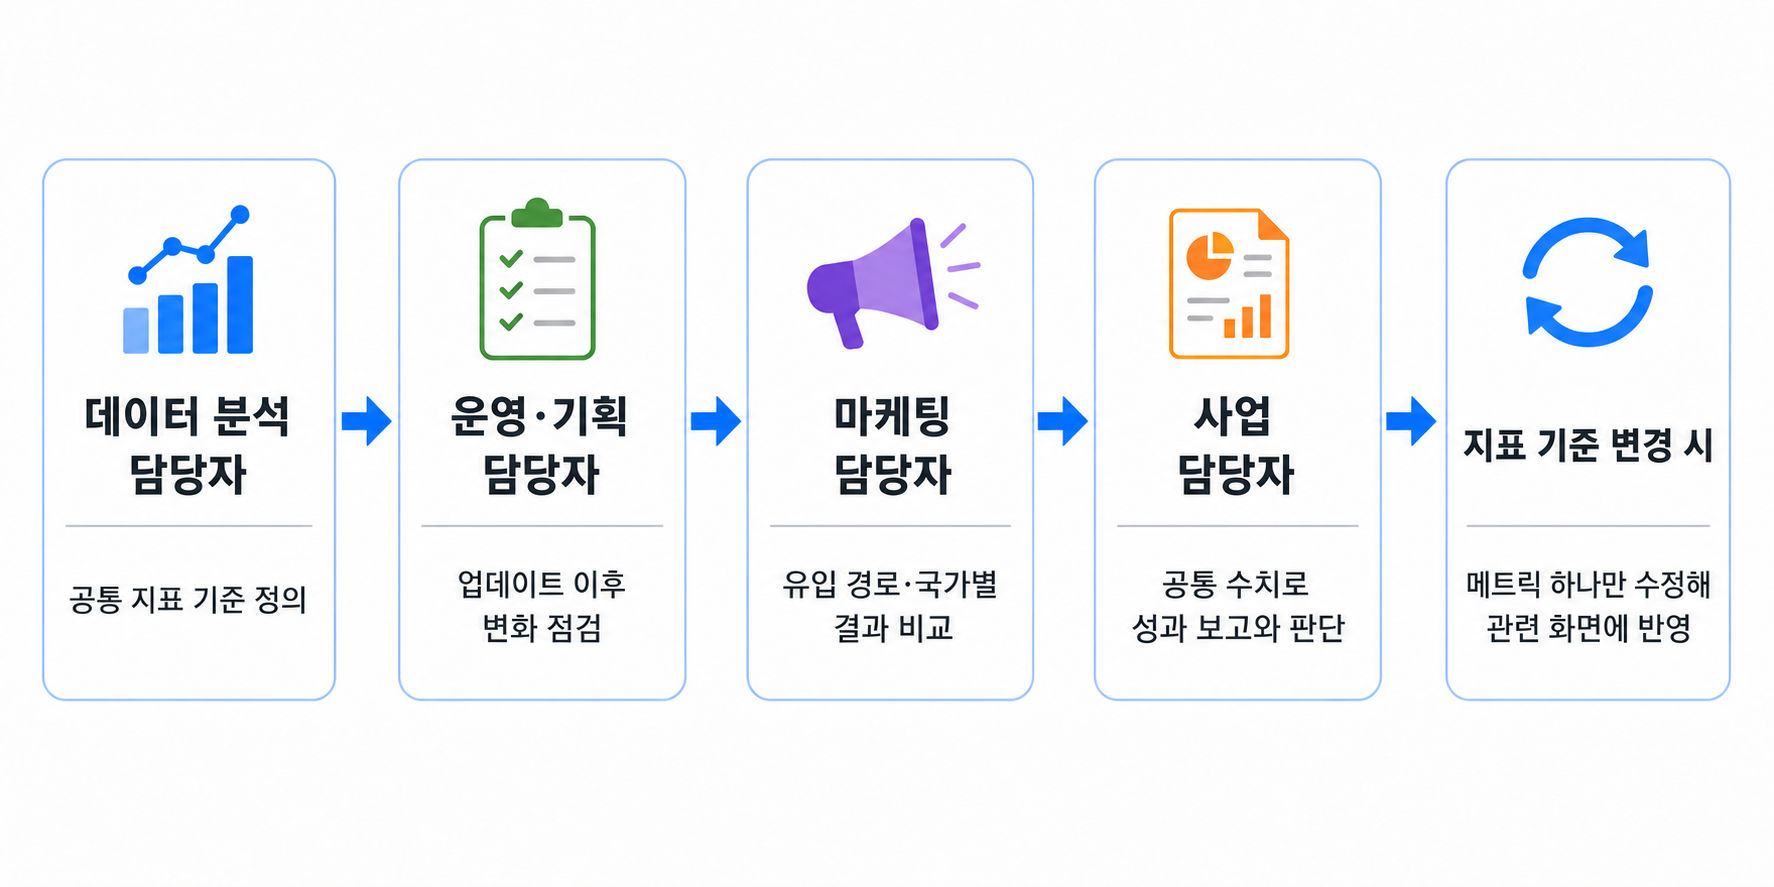
Operations and planning staff can check the impact of an update, while marketing teams can compare results by acquisition channel or country. Business teams can report on performance and decide on next steps based on the same figures.
In contrast, if each team creates its own metrics, the events and aggregation methods used can end up different. When multiple metrics share the same name, or descriptions are insufficient, it becomes difficult to determine which figure should serve as the standard.
When policies or analysis goals change and a formula needs to be updated, modifying related charts one by one can leave some screens out of sync. When the old standard and the new standard are used side by side, discrepancies appear between reports and dashboards as well.
Managing Metrics in Hive Analytics
Metrics in Hive Analytics let you save and reuse metric settings that are frequently used in charts. Commonly used metrics such as users and purchases are provided by default as Platform Metrics, so you can use them right away without any additional configuration. Platform Metrics cannot be edited or deleted, in order to keep metric standards consistent. When needed, however, you can combine conditions and formulas to fit a specific organizational or project purpose and add them as a Custom Metric. You can freely combine events, property values, aggregation methods, and formulas through the UI without knowing SQL, so even team members who aren't data analysts can easily create and save the metrics they need for their work as a single Metric.
Using COUNT, COUNT DISTINCT, SUM, and AVG, you can define metrics as event occurrence counts, unique user counts, total revenue, or average values. You can record the calculation method and purpose in the title and description, classify the metric under categories such as users, revenue, sessions, or gameplay, and reuse it across multiple charts.
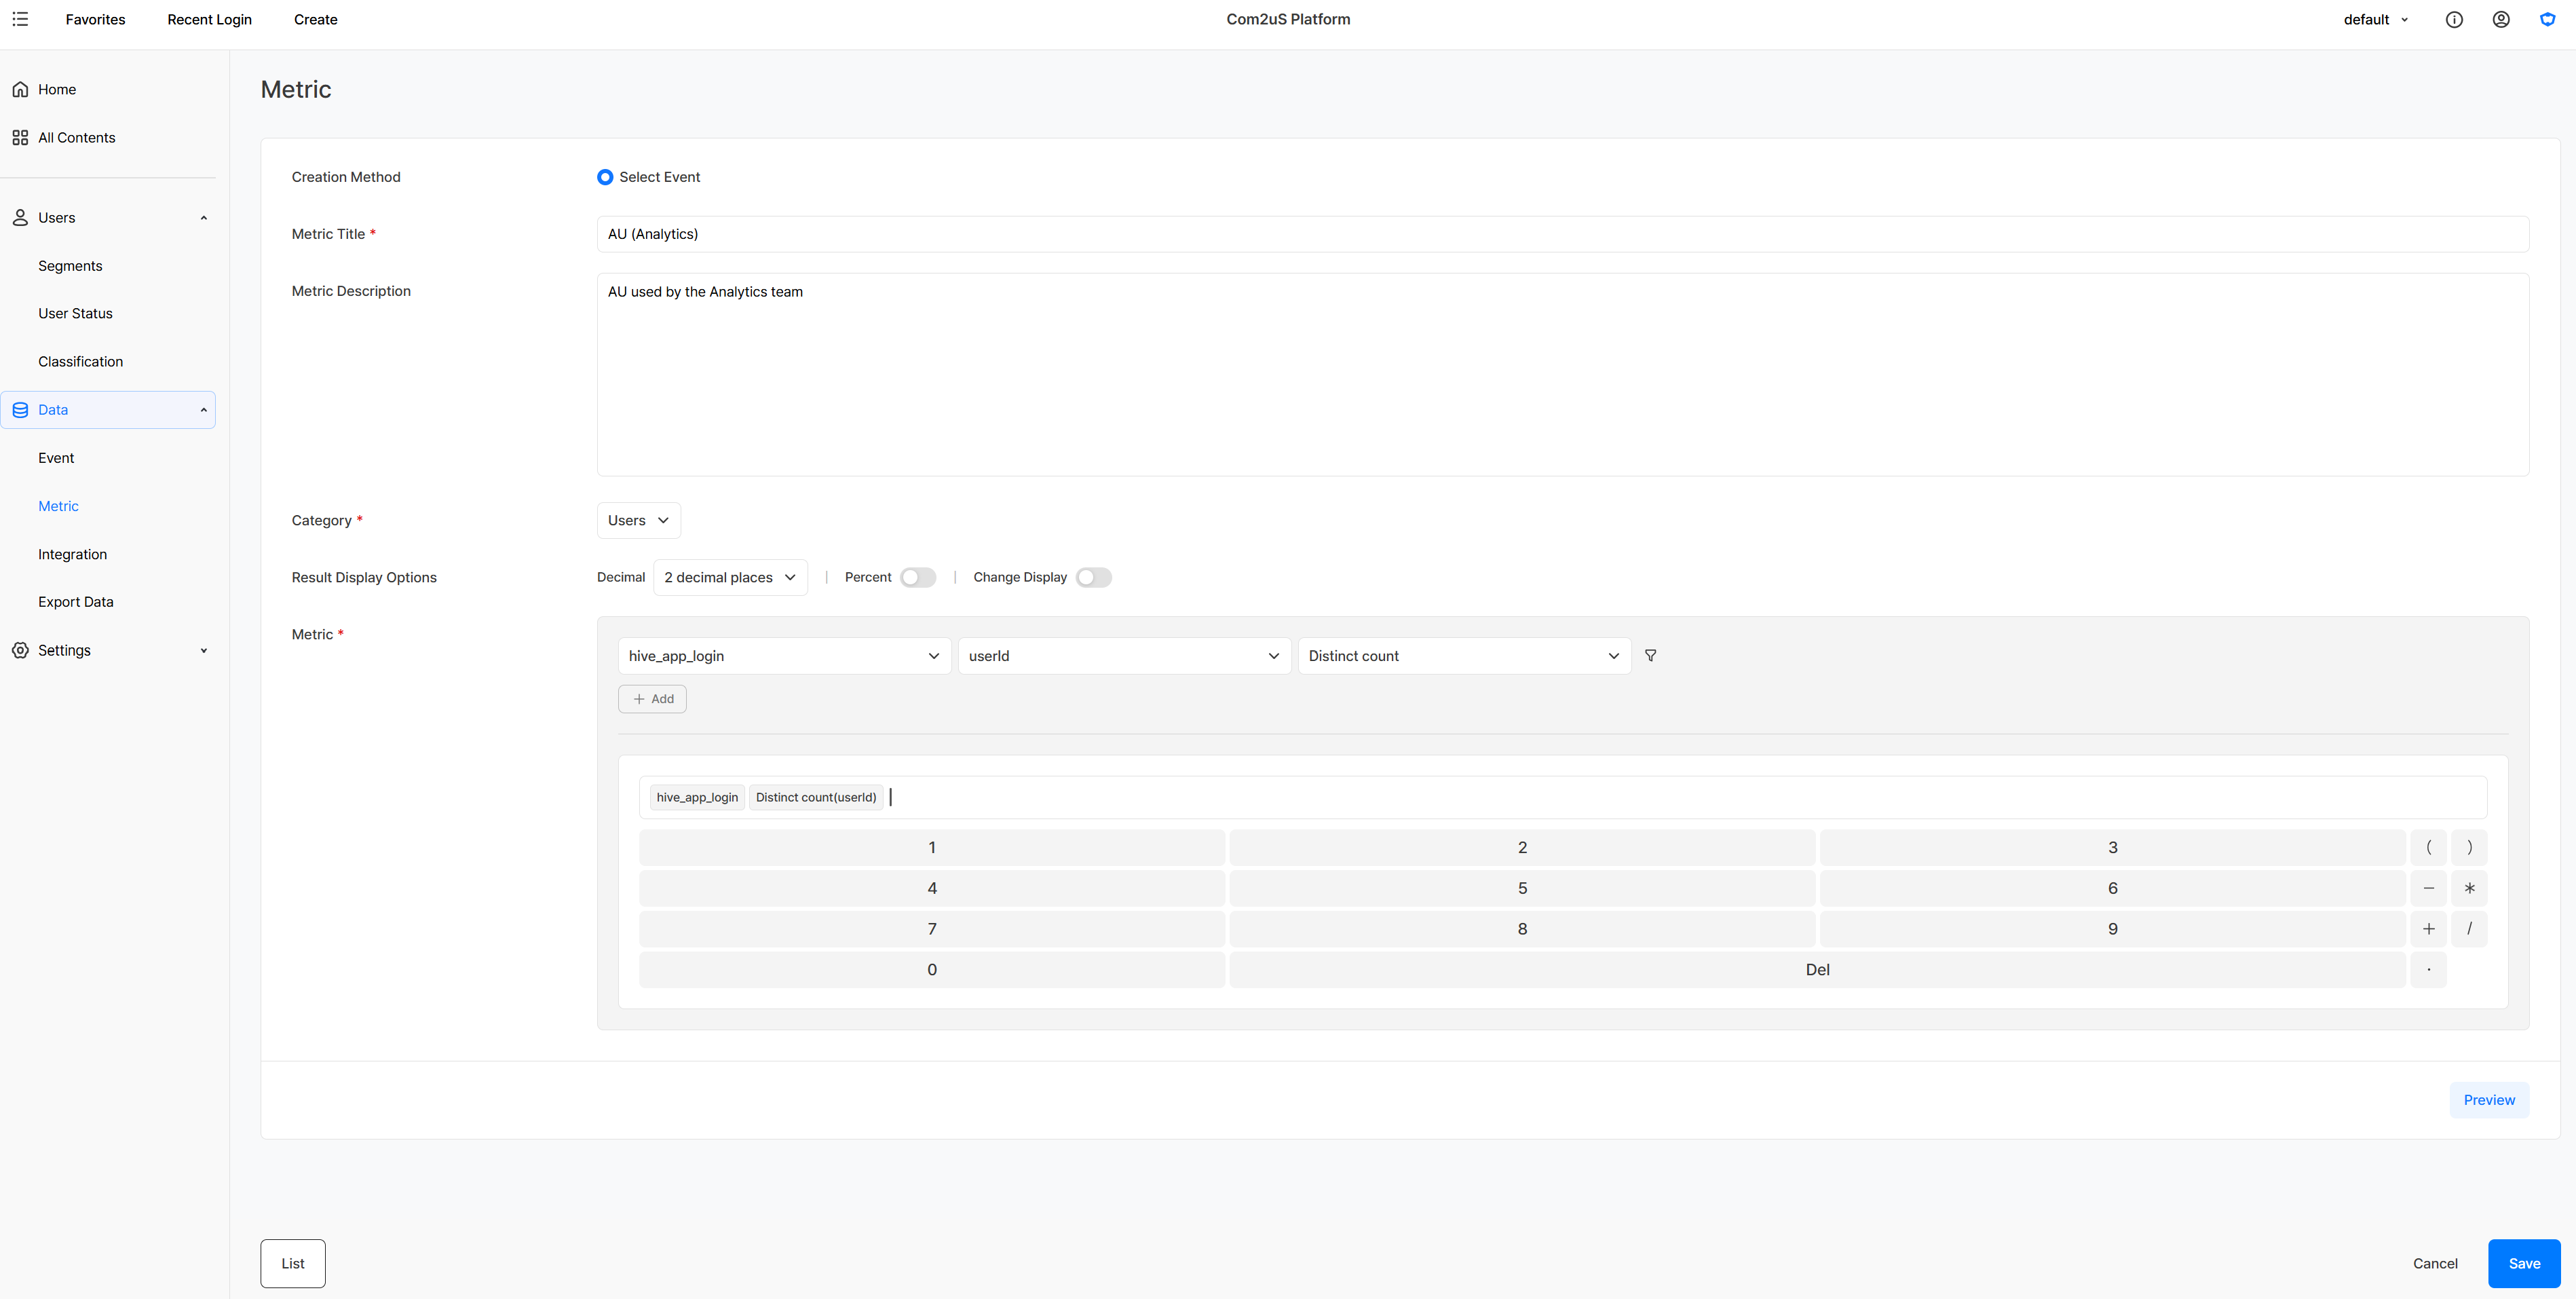
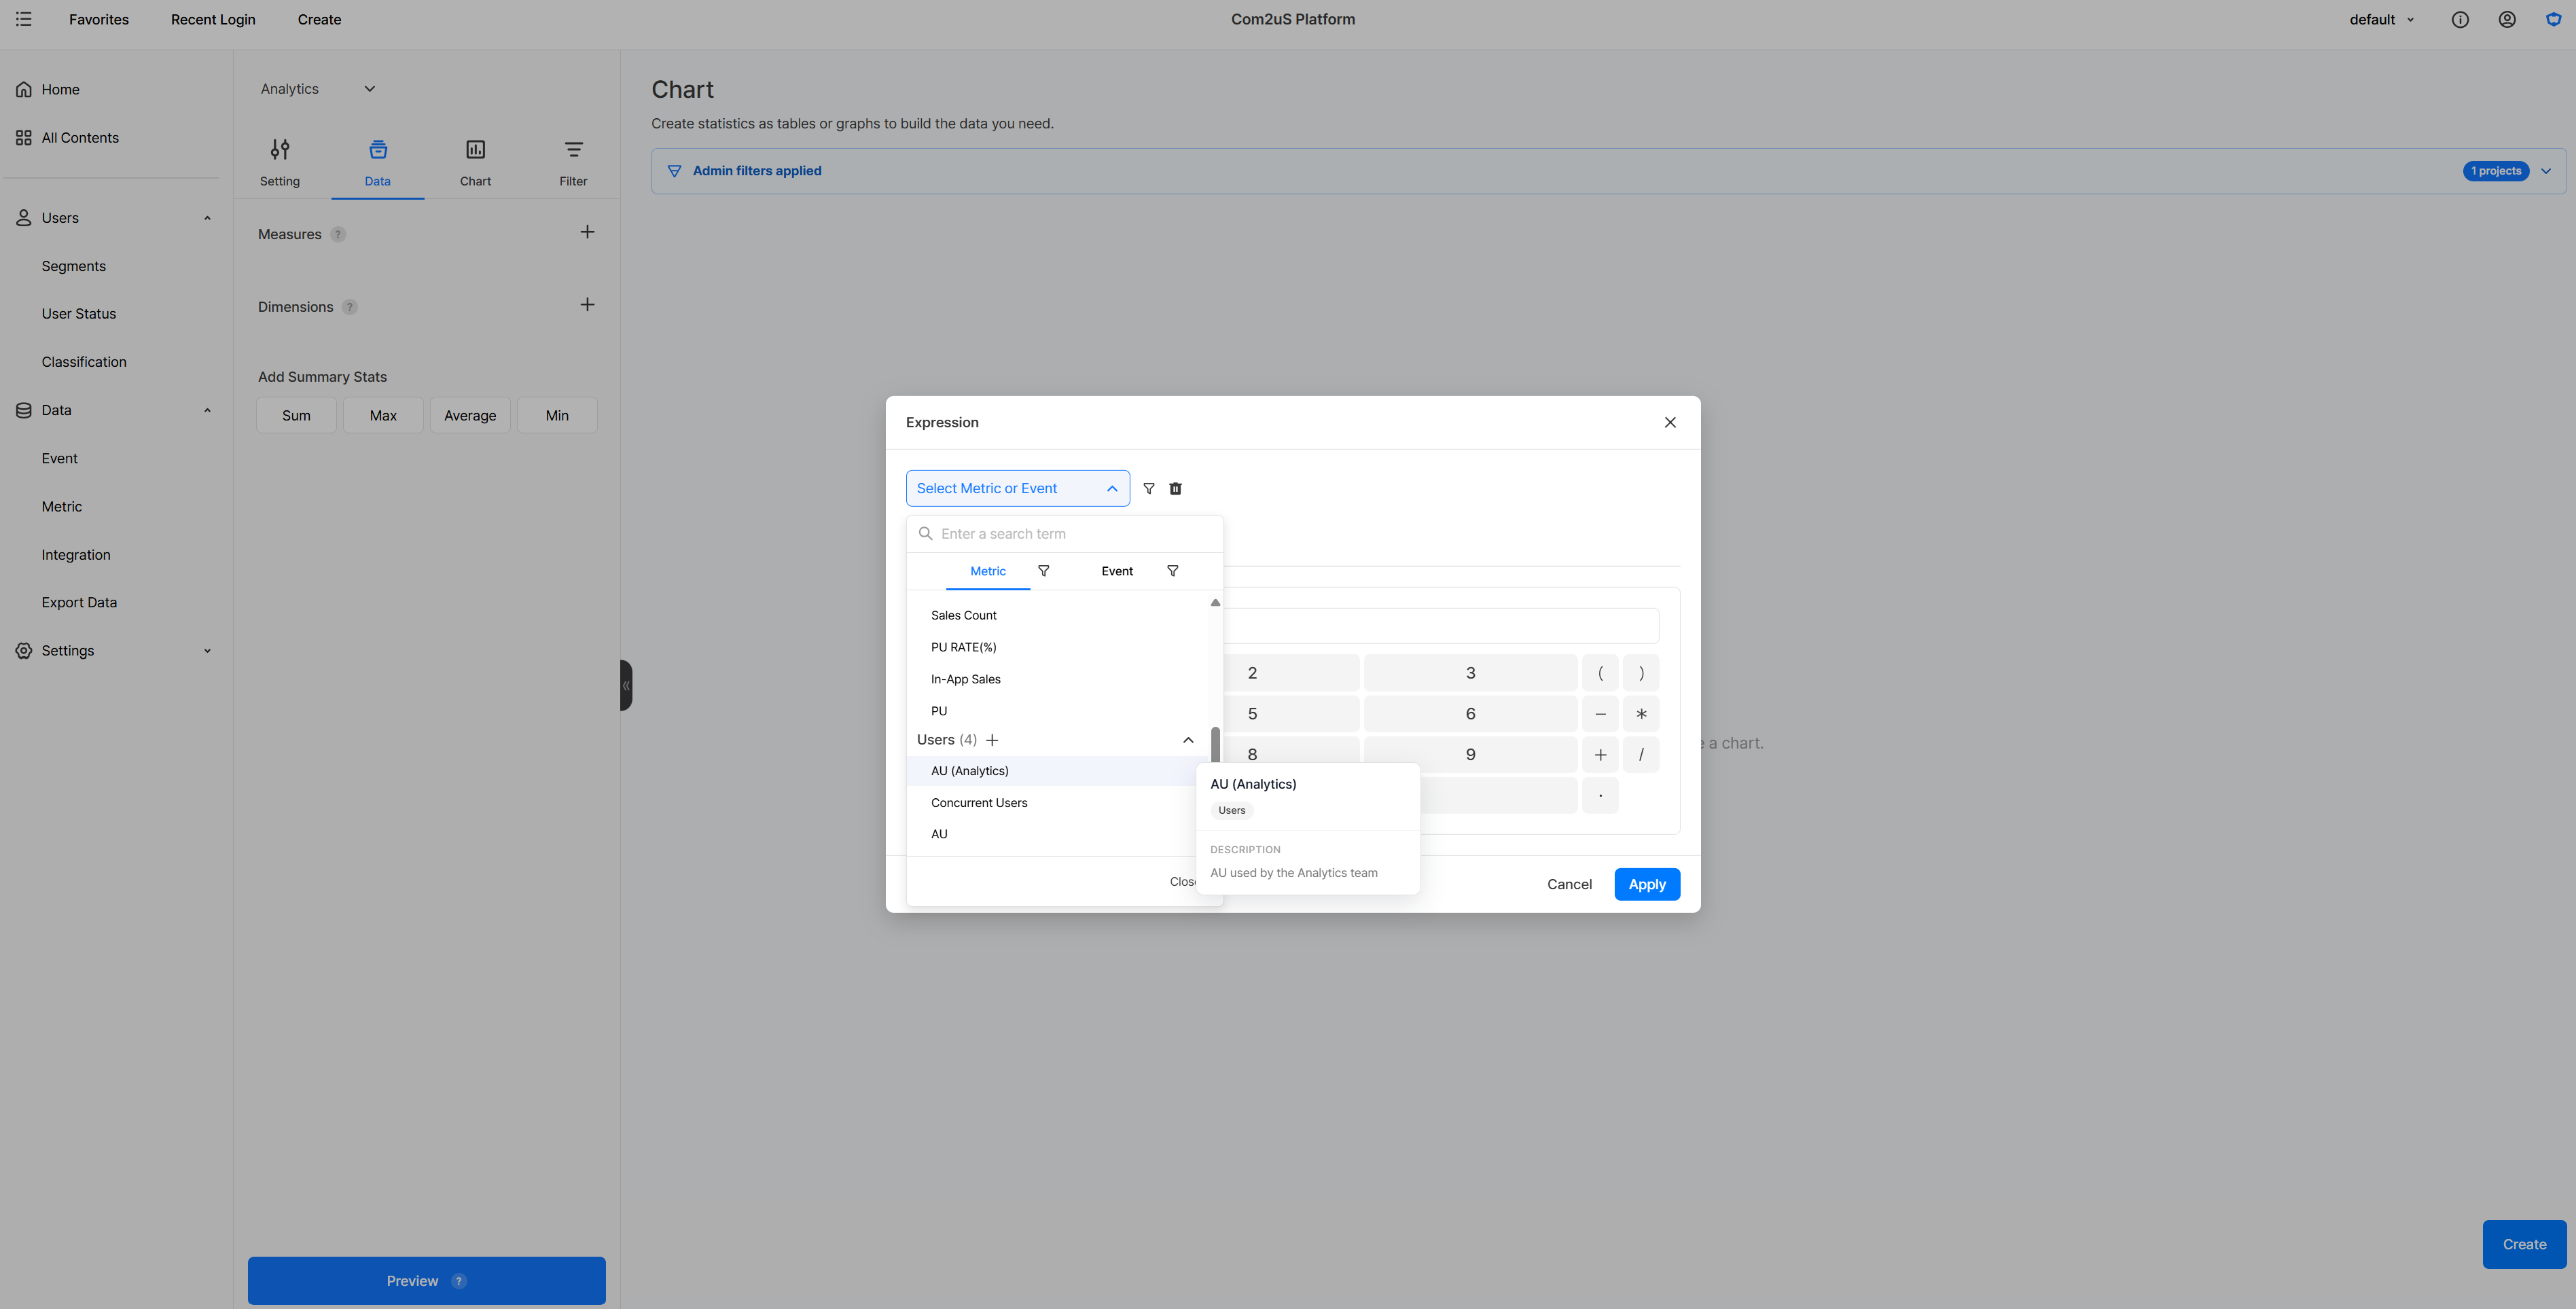
When you change a metric's calculation criteria, the change is reflected in every chart and dashboard that uses that metric. This lets you maintain a consistent standard without editing multiple screens individually, but because related figures can change the moment you make the edit, you should check the scope of impact before making any changes.
Building a Common Metric Standard
A metric can be built from a single event, or defined by combining two or more events with a formula. Any conditions you need can be set as event filters, allowing you to build common metrics in the following ways.
Creating a Metric from a Single Event
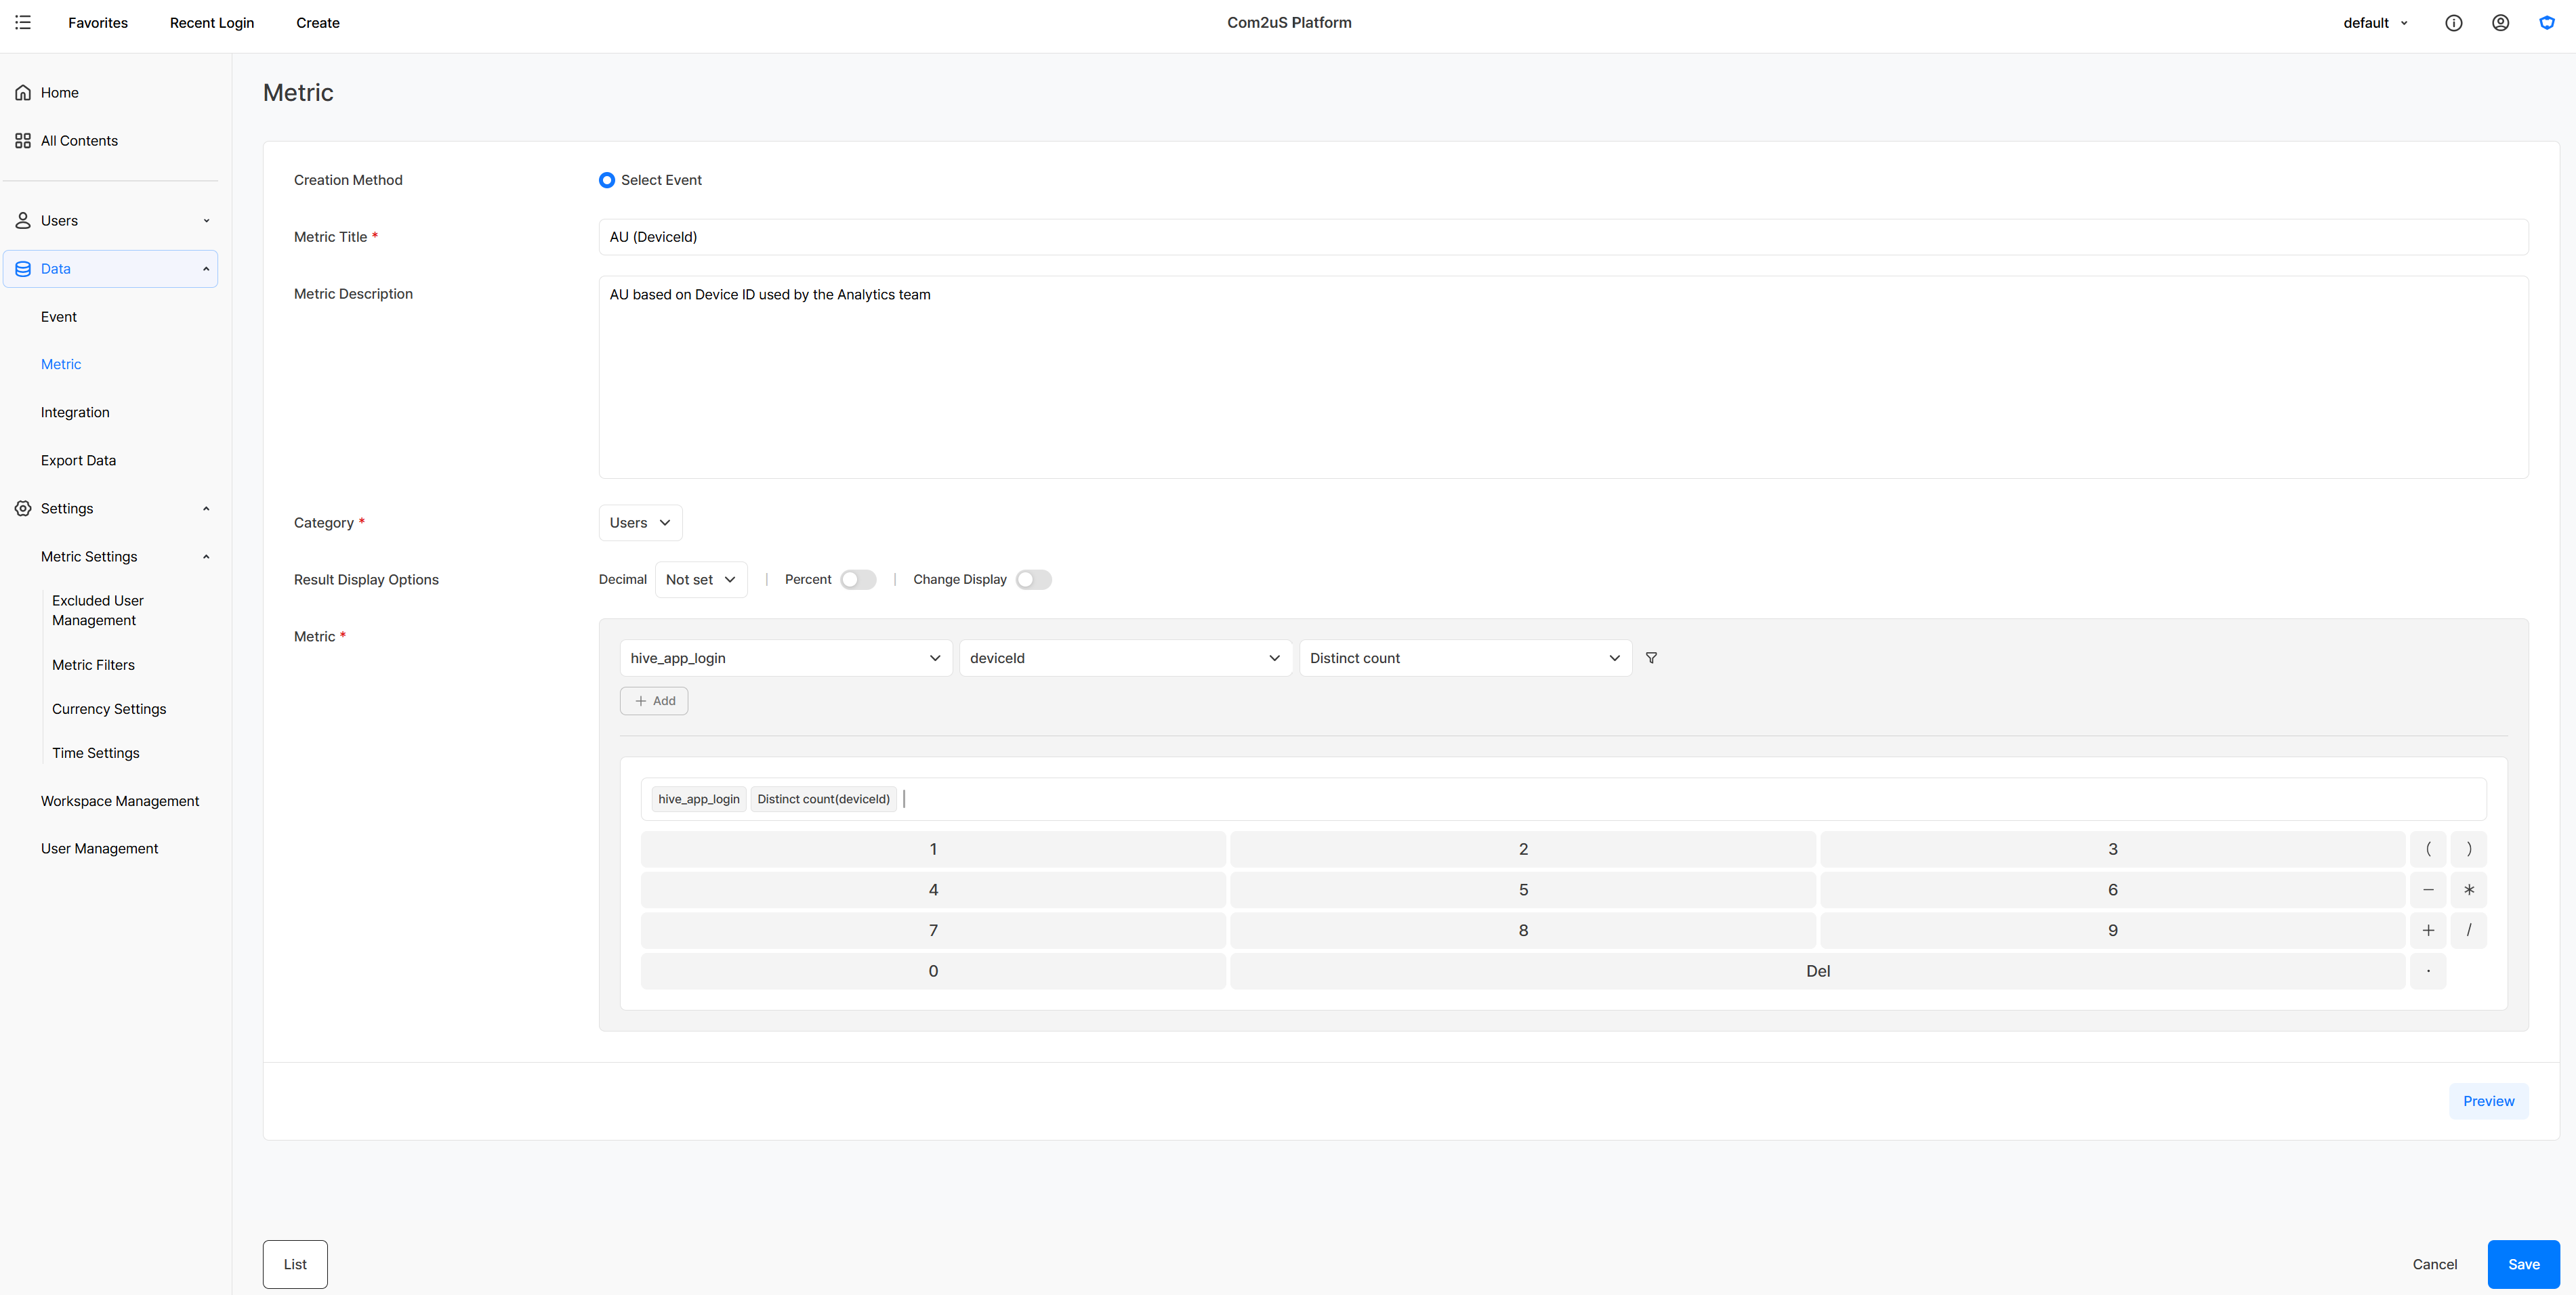
You can create a metric by selecting the field to check from a single event and applying an aggregation method. For example, calculating the unique count of device identifiers from the login event lets you define AU based on the number of devices that connected during a given period.
Creating a Metric with Two or More Events and a Formula
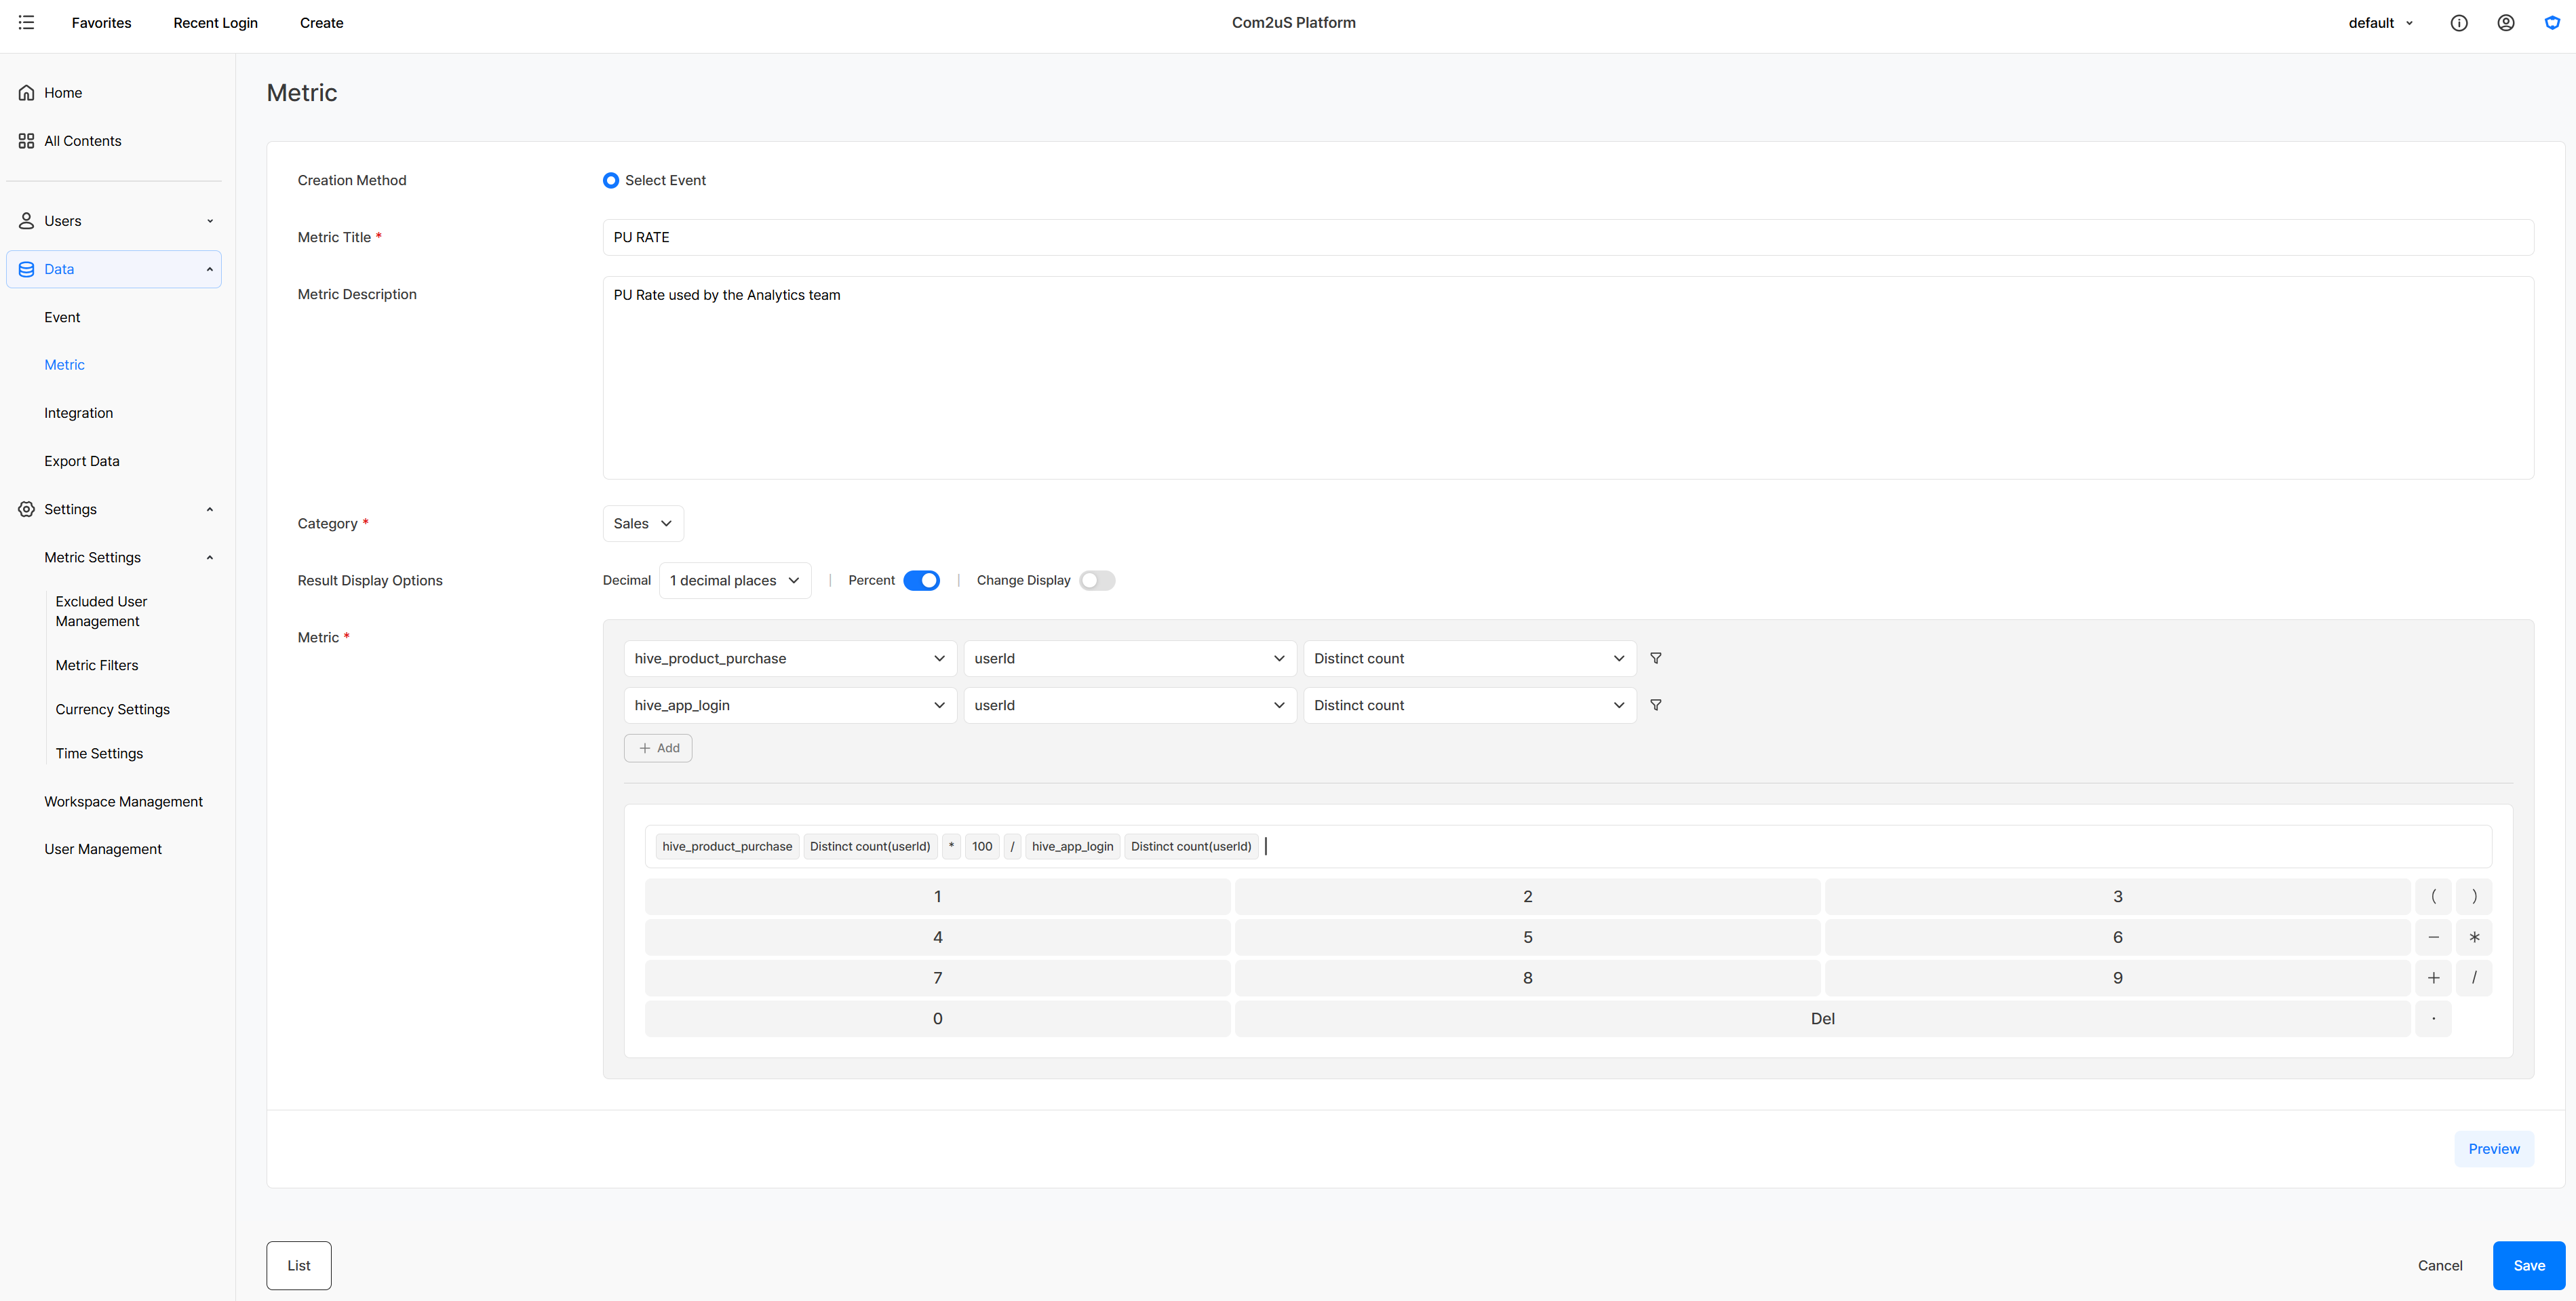
You can calculate the values you need from two or more events separately, then combine them with basic arithmetic operations into a single metric. For example, combining the number of purchasing users with the number of logged-in users lets you define a metric like purchase conversion rate, which calculates multiple pieces of data together, as a common standard.
Creating a Metric with an Event Filter Applied
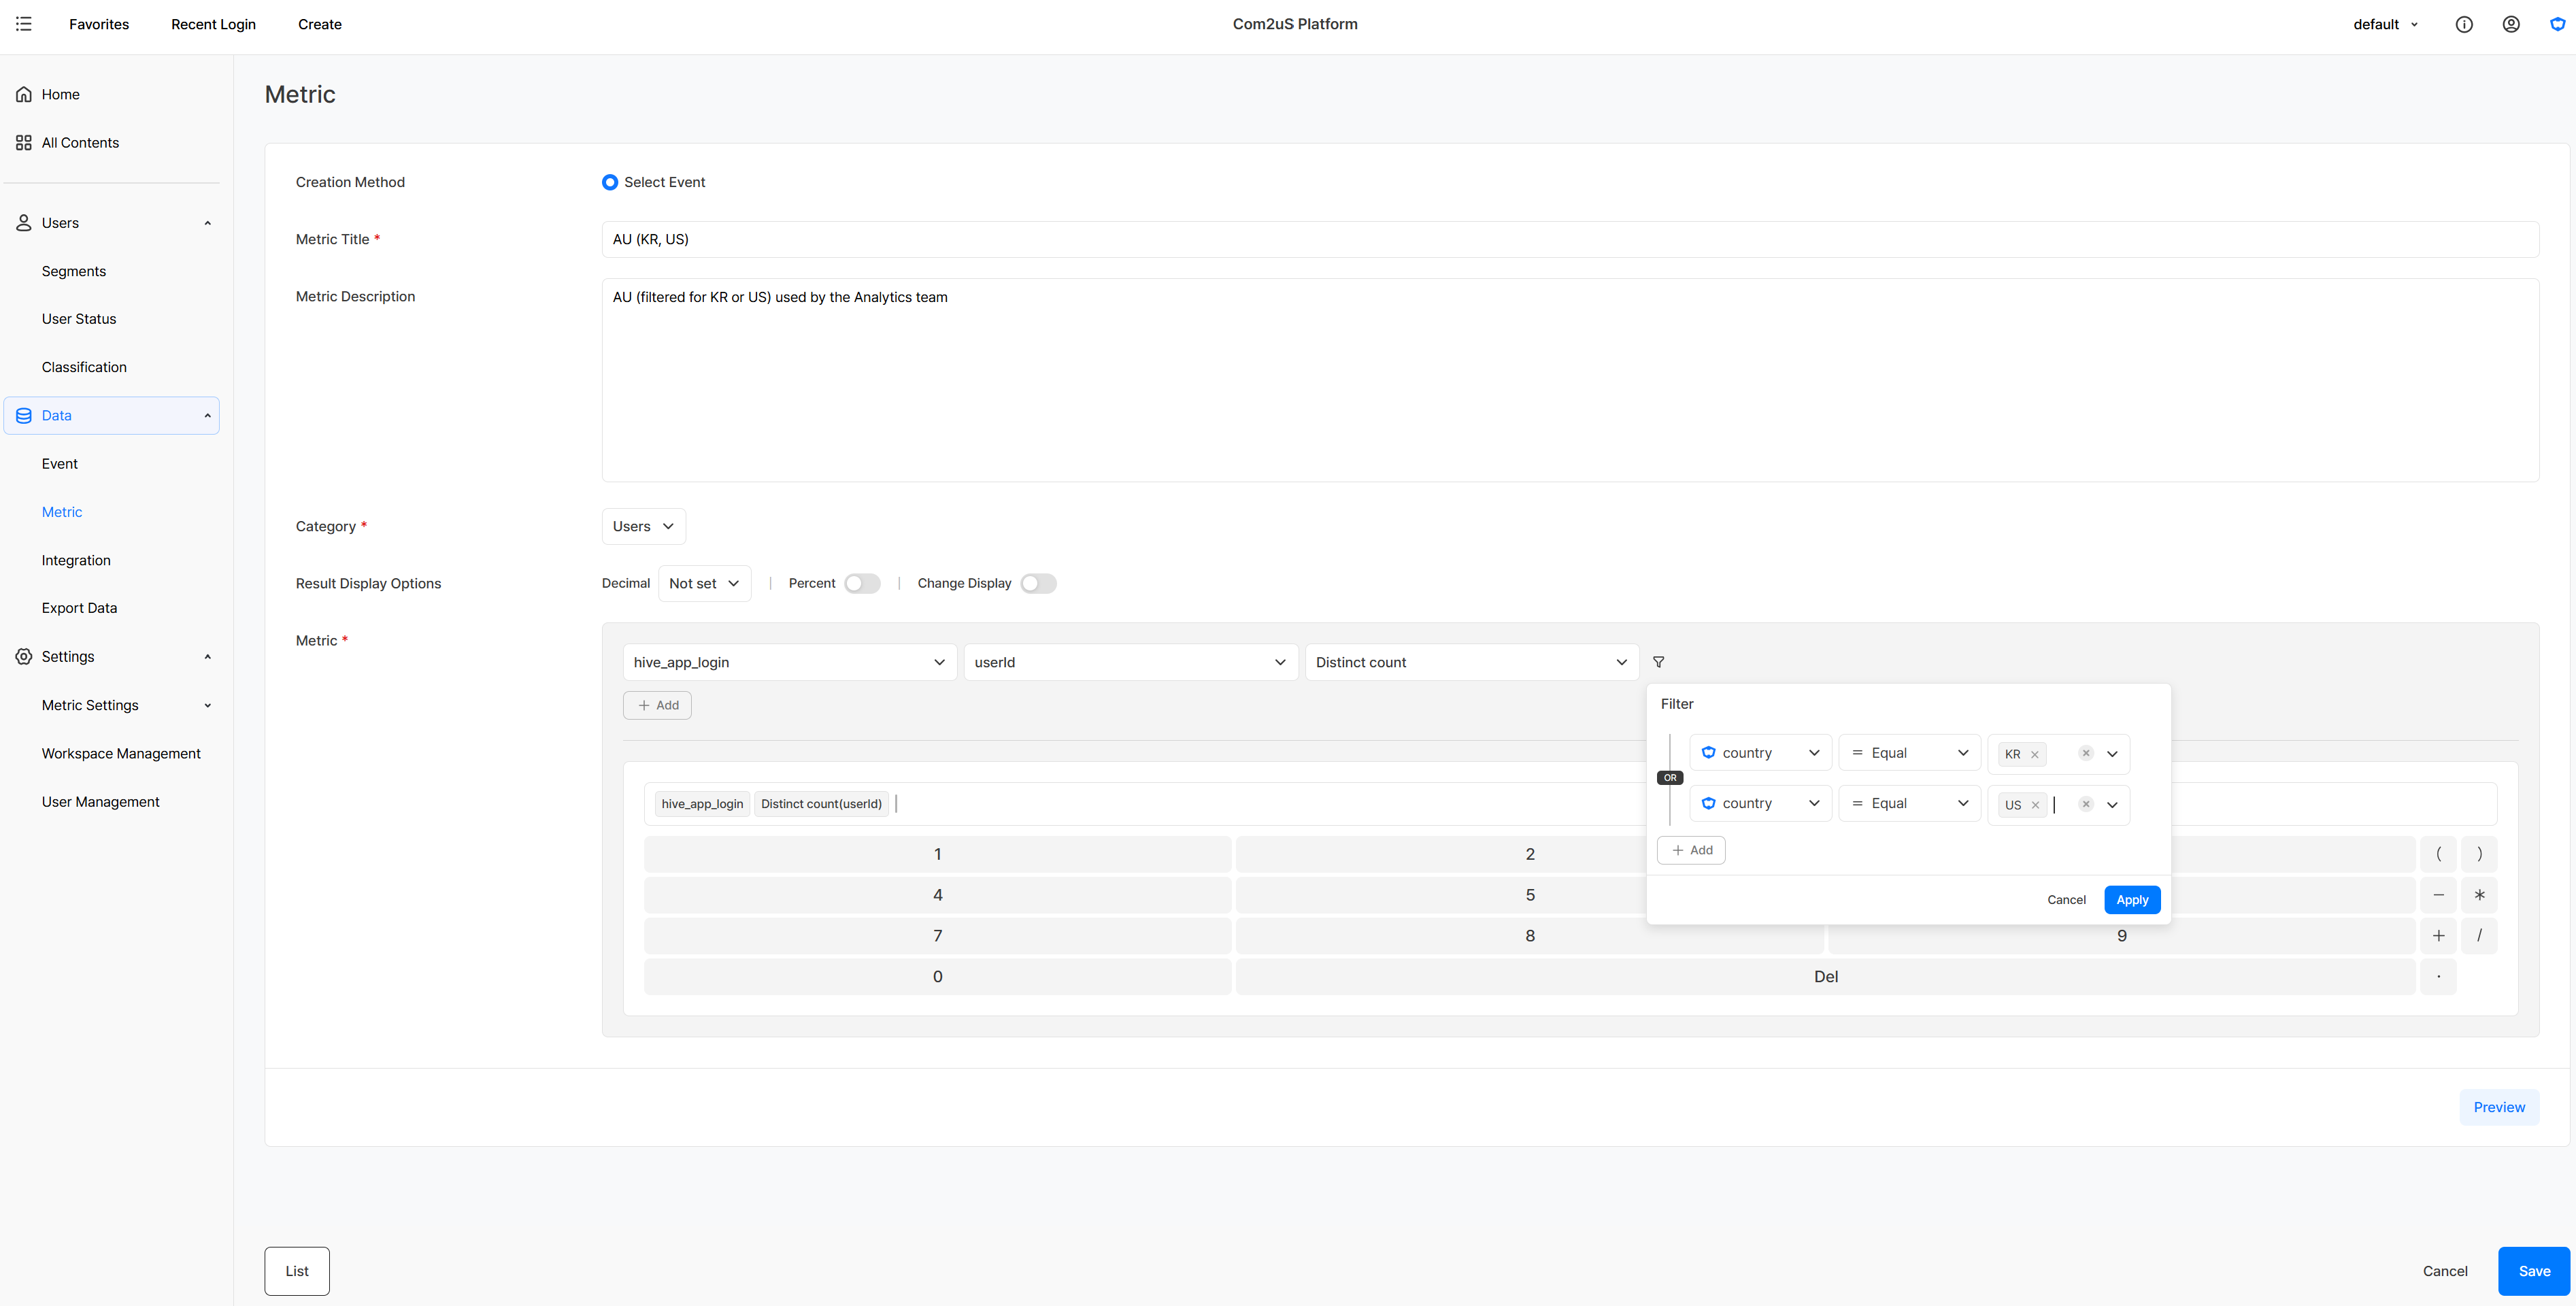
When selecting the event to use for a metric, you can apply a filter based on a field. Just as you might specify a condition for country being KR or US on the login event, you can include only the data you need to build a metric suited to your purpose.
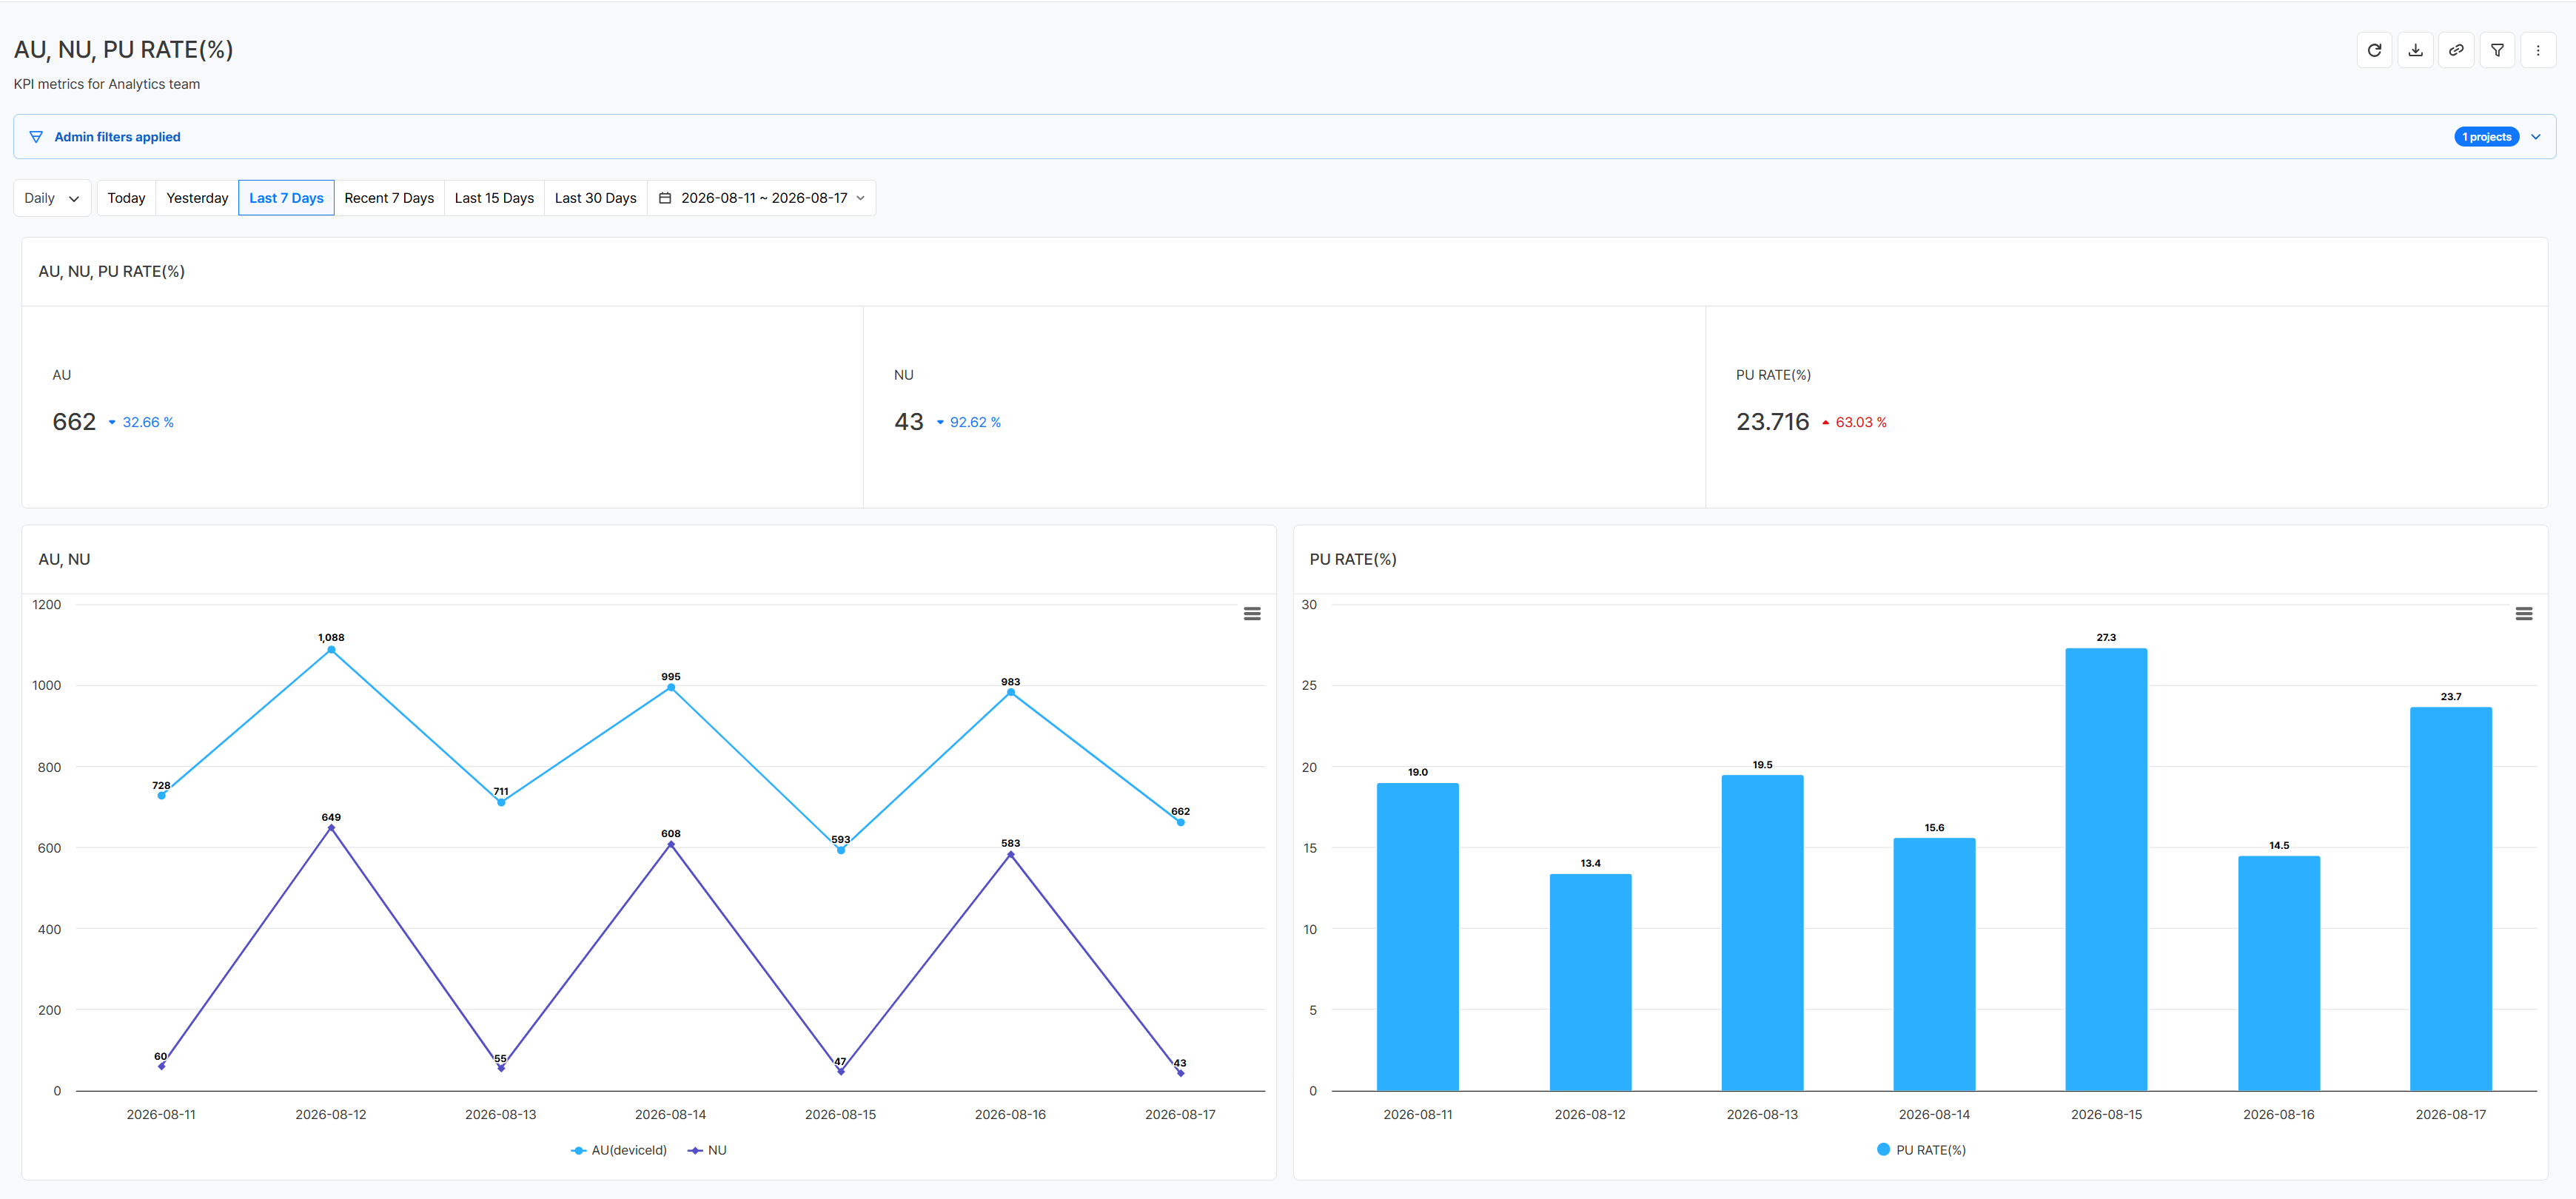
Metrics configured this way can be viewed in charts and dashboards. When you update a metric's calculation criteria, the change is automatically reflected across every screen that uses it, keeping the same standard consistent everywhere.
Get Started with Hive Analytics
Common metrics give an organization a shared standard for communicating through data. Rather than having each team create its own version of a similarly named metric, managing frequently used calculation methods as Metrics reduces discrepancies in numbers and keeps analysis standards clearly shared.
Once you integrate the Hive SDK, Hive Analytics automatically collects over 60 standard game events, and you can freely define custom events to send for any additional in-game behavior you want to track. By combining these collected events, you can build a variety of metrics tailored to your organization's goals.
Start now with Hive Analytics to manage common metrics and use consistent figures for analysis and decision-making.