Finding Marketing Performance Differences by Dimension
A performance gap that overall metrics don't reveal can only be found by breaking the data down by country, market, OS, and other user conditions. In Hive Analytics, you can start at the country and market level and narrow down step by step through OS, app version, and device model to pinpoint where the cause is concentrated.
Performance differences hidden behind overall metrics
Even when overall results look stable, not every user group produces the same outcome. Depending on the acquisition environment, purchase conversion and revenue can move in different directions.
If new users or revenue drop in only one user group, the change can look small in the overall metrics. The more countries and platforms you acquire users from, the more you need to look beyond the average and check where the variance shows up.
A closer look before judging performance
Even when acquisition results differ from what you expected, it's hard to conclude that the creative or the media channel alone is the cause.
Users brought in by the same campaign can behave differently afterward depending on their region or environment. In one region, new user acquisition may keep growing while purchases and revenue stay relatively low; in another, conversion may be higher even with a similar acquisition volume.
So before adjusting your overall campaign direction, you need to break the results down by user condition and find where the difference is concentrated. This makes it possible to pin down which metric — acquisition volume, purchase conversion, or revenue — changed, and in which group.
Multi-dimensional analysis in Hive Analytics
Once you integrate Hive SDK, Hive Analytics automatically collects the basic events and properties needed for game analysis. You can use the country, market, OS, app version, device model, language, and server information included in these events to segment users and results. If there's a behavior or condition specific to your game, you can define and send your own events and properties, extending the analysis to fit your game's situation.
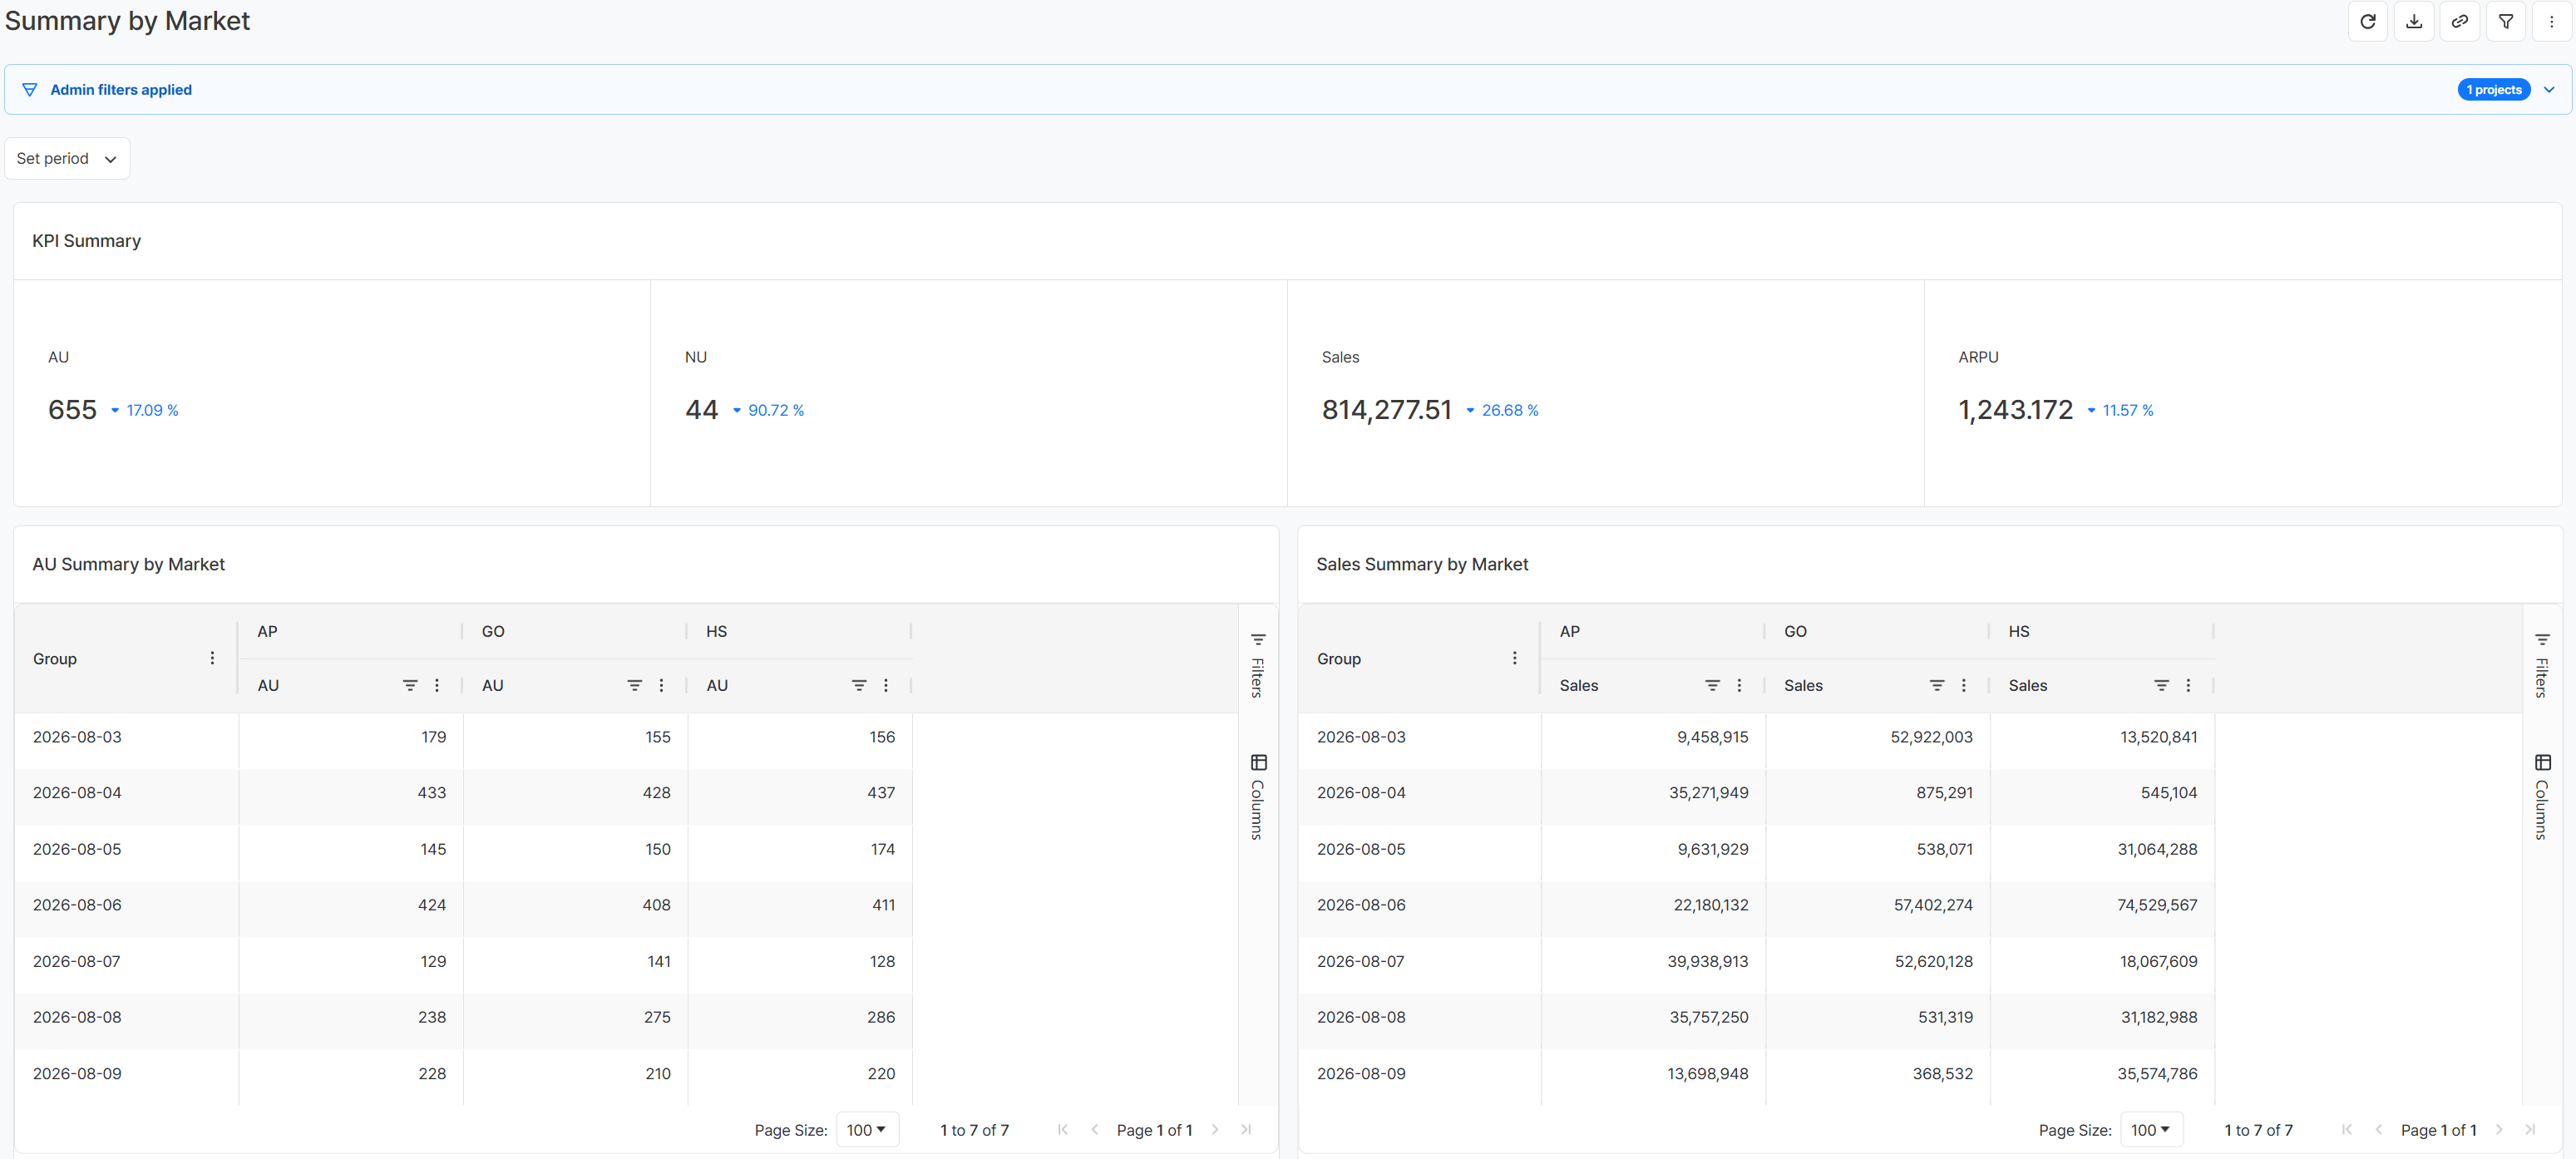
If overall metrics have changed, you can start by splitting the data by country and market, then narrow down further by OS and app version. If your game needs its own criteria, add custom events and properties to segment further.
The point isn't to keep checking the same fixed set of items. It's to add whatever information you need to the data collected automatically, and narrow down step by step to where the difference occurred.
If you integrate an MMP, you can also bring in acquisition channel and campaign information. Connecting this to in-game behavior lets you see, in the same analysis flow, how users from a specific channel perform depending on their environment.
How purchase behavior differs by country
Looking at Korea and Japan over the same period, new users may increase in both regions. But when you also look at revenue, Korea's revenue may grow along with new users while Japan's revenue declines even as new users increase.
Adding purchase conversion makes the difference clearer. If Japan's conversion rate is lower than Korea's, you've found that acquisition growth translates into purchases at a different rate by country — a gap in purchase conversion and revenue that the new-user count alone doesn't reveal.
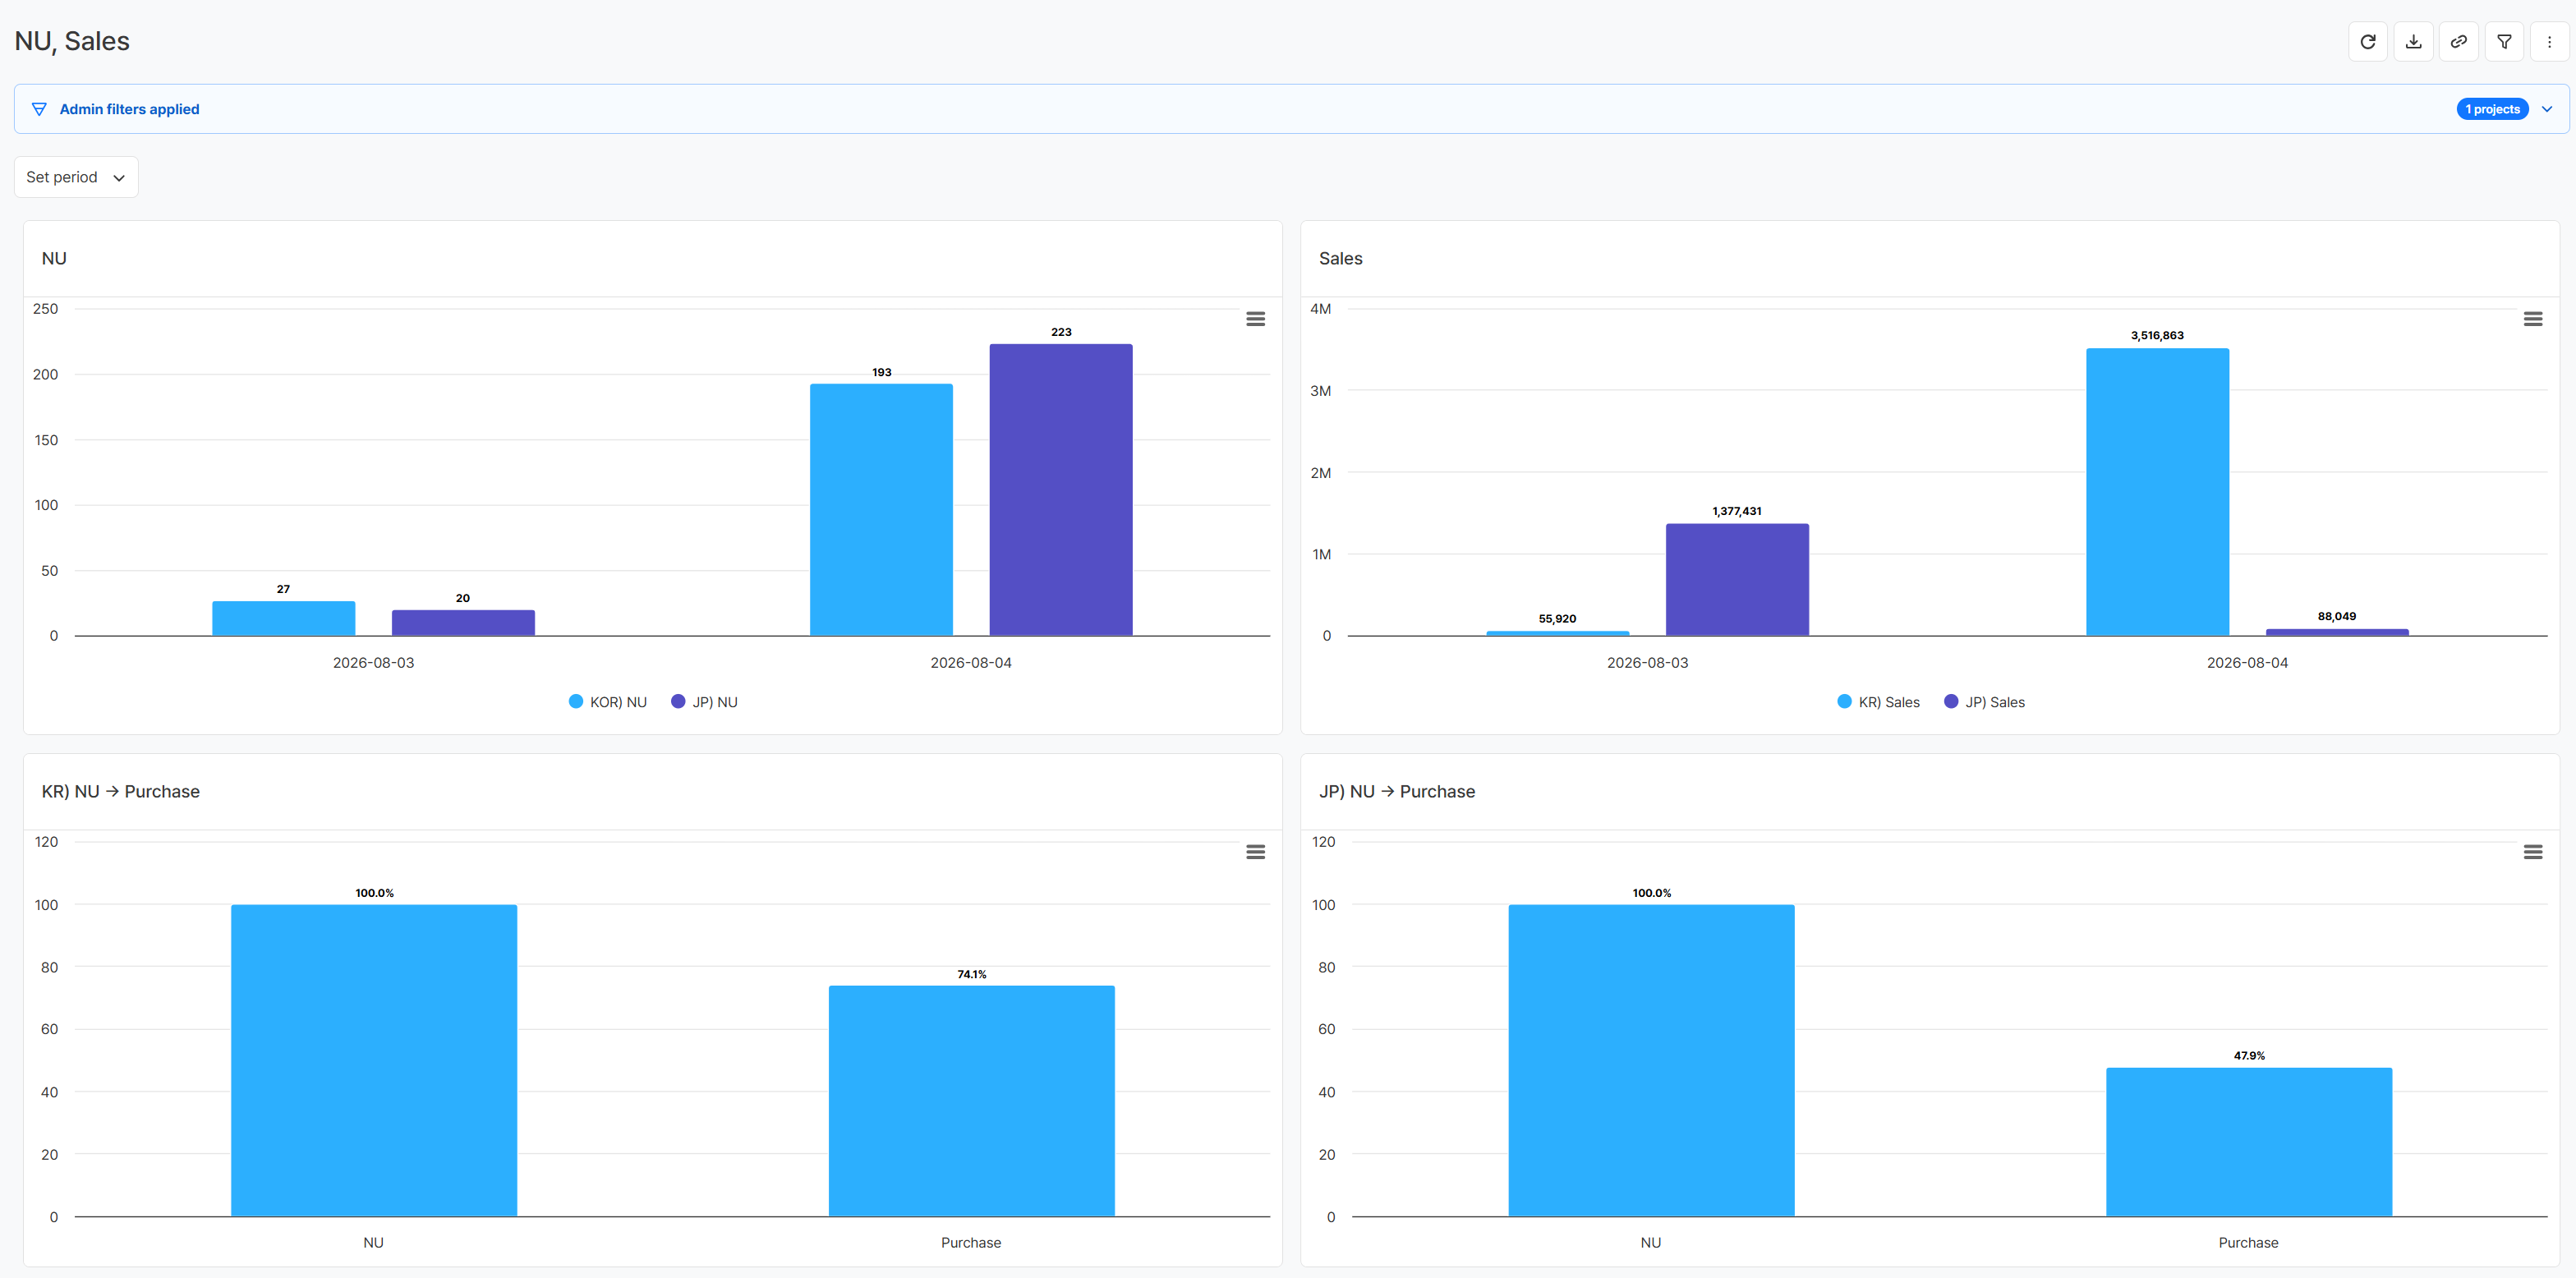
From here, you don't have to stop the analysis — you can break down Japanese users further by OS, app version, device model, language, and server. If purchase conversion or revenue stands out in a specific group, you can pin down exactly which users were affected.
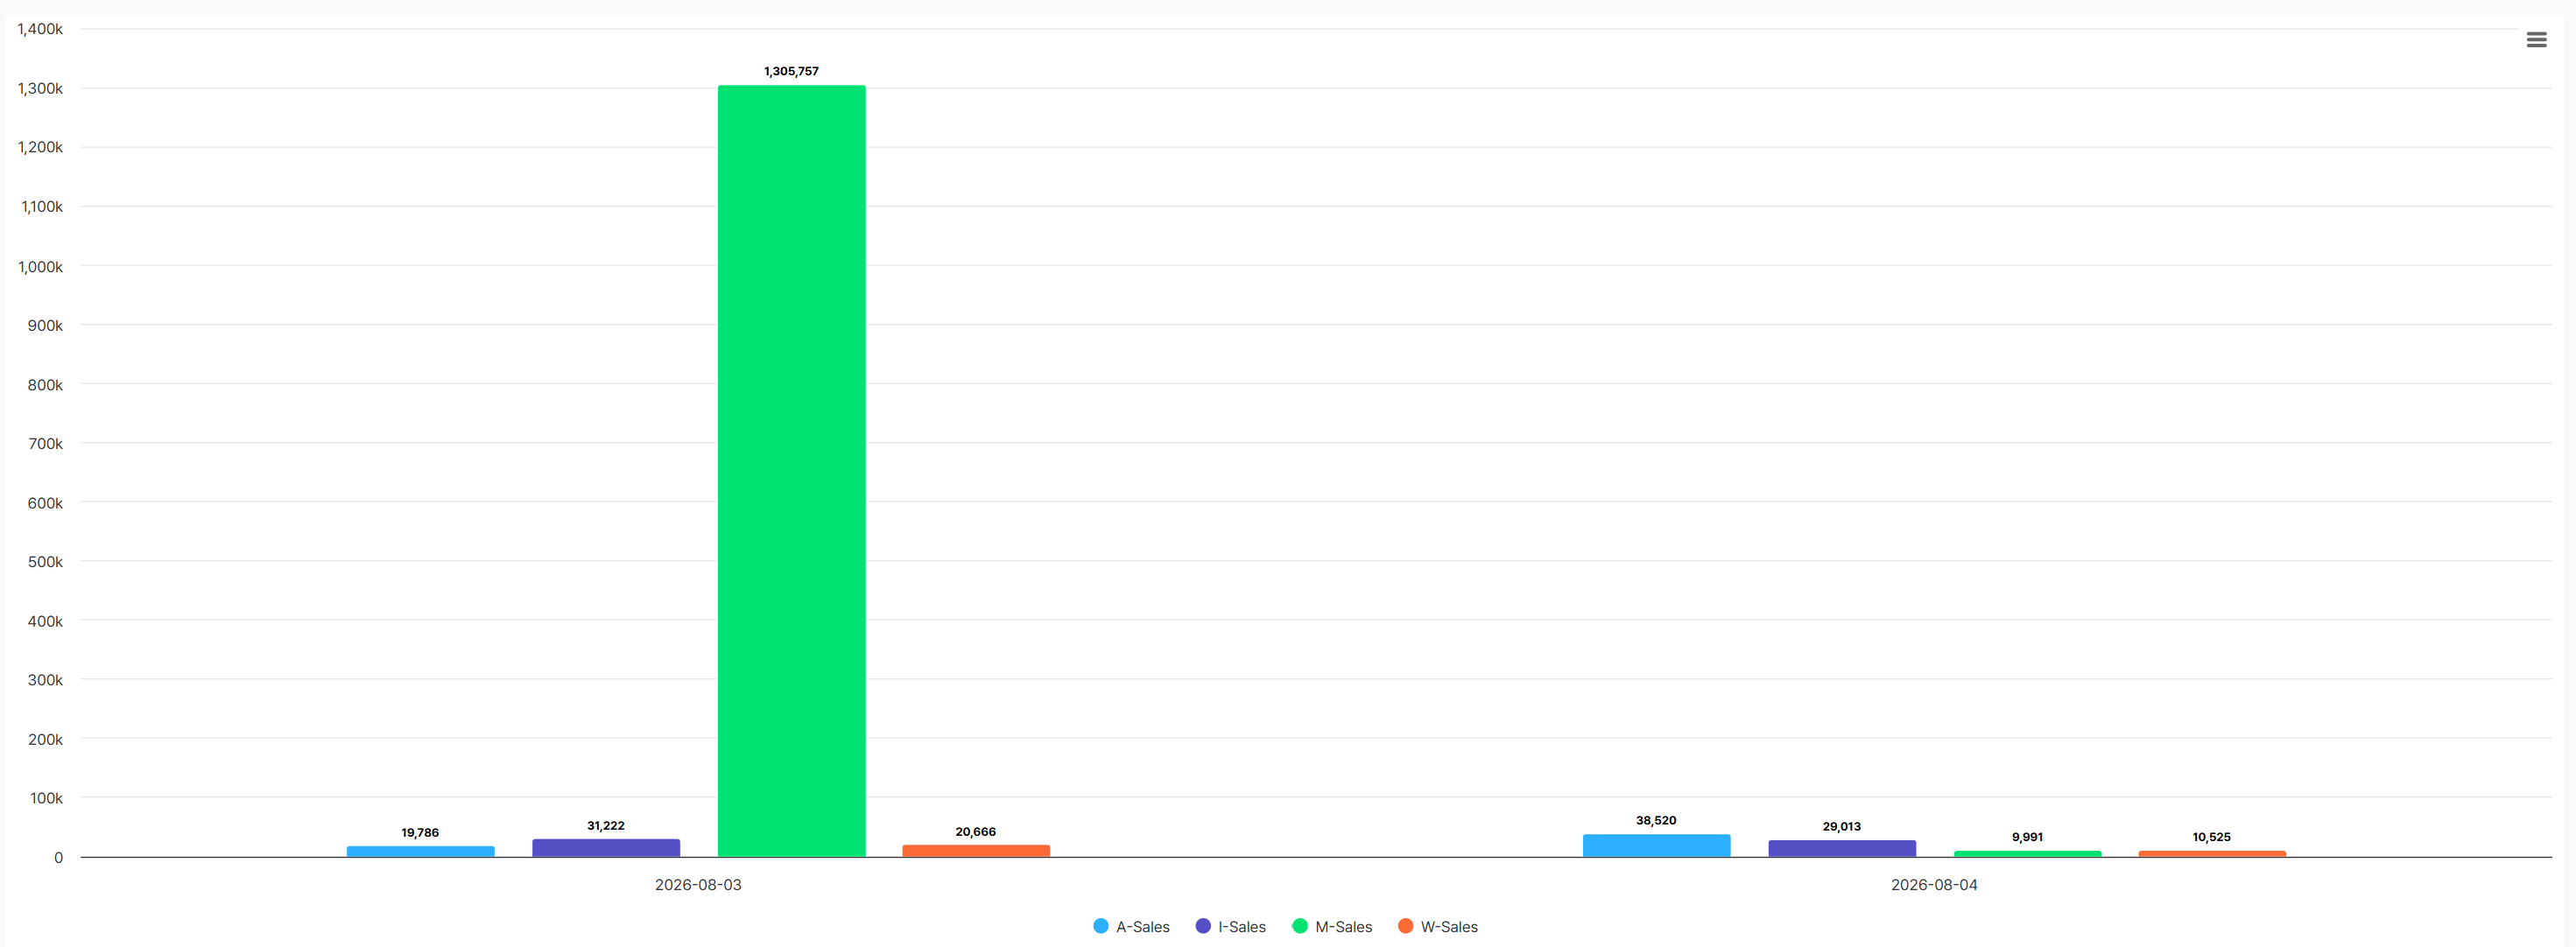
This kind of analysis is useful for finding where an actual gap shows up before applying the same action across every region. Look at acquisition volume alongside purchase and revenue trends, and check whether changes after an app update are concentrated on a specific operating environment — then use that as the basis for your next decision.
Get started with Hive Analytics
Overall metrics alone make it hard to pin down where a gap started. Breaking the data down by user condition reveals group-level characteristics hidden behind the average.
With Hive Analytics, you can use the game events and properties collected through Hive SDK to break down post-acquisition behavior by multiple criteria. Send additional data to extend your analysis scope, and integrate an MMP to review results by acquisition channel as well.
Start now with Hive Analytics to identify the traits of each user group, find where the differences stand out, and put that toward more effective game operations.