Tracking Players' Return Flow With Retention
Total user counts alone can't show whether players who were active at a given time actually come back later. You need to group users who took a specific action at the same time and check whether they return. Hive Analytics' Retention feature lets you set a base event and a return event to analyze return visits or a shift to another action. Adding dimensions like country or OS helps narrow down which user groups show the clearest change, and connecting different events lets you see flows such as logging in again after finishing a piece of content.
Why Total User Counts Don't Show the Return Flow
Looking at user counts tells you the overall scale of players using your game, but it doesn't show whether users who were active at a given time actually come back later. Even if the total stays steady, it matters whether that's because existing users kept returning or because new users replaced the ones who churned. That's why you need to group users who took a specific action at the same time, then check whether they reconnected or repeated the action you care about.
Retention Analysis for Improving Content
Game planners need to check whether new content or an update led to sustained activity. If you added new content, look at whether the users who engaged with it keep using it or return to the game afterward. If you shipped an update, check whether return visits hold up afterward, and whether the return flow of new users who joined before and after the update changed.
Checking differences in user environment, such as country or OS, lets you pinpoint exactly when and for which user groups the change stands out. This lets you look not just at the initial reaction to content but whether activity continues afterward, so you can prioritize what to improve.
Retention in Hive Analytics
Retention in Hive Analytics groups users who triggered a base event at a given time, then analyzes whether they went on to trigger a return event. Setting the base and return events to the same event lets you check whether that same action repeats; setting them to different events lets you see whether the base action led to a different one.
After setting the project and date range, choose a daily, weekly, or monthly aggregation unit, then specify the base event, return event, and user identifier. Adding the base event's property as a dimension lets you split and compare user groups by conditions like country or OS, and filters let you narrow down which users and events to analyze.
You can check Retention results as a table or a line chart. The table compares, by elapsed days, the return count and rate of users who took the base action in the same period, while the line chart shows how a given user group's retention rate changes over time.
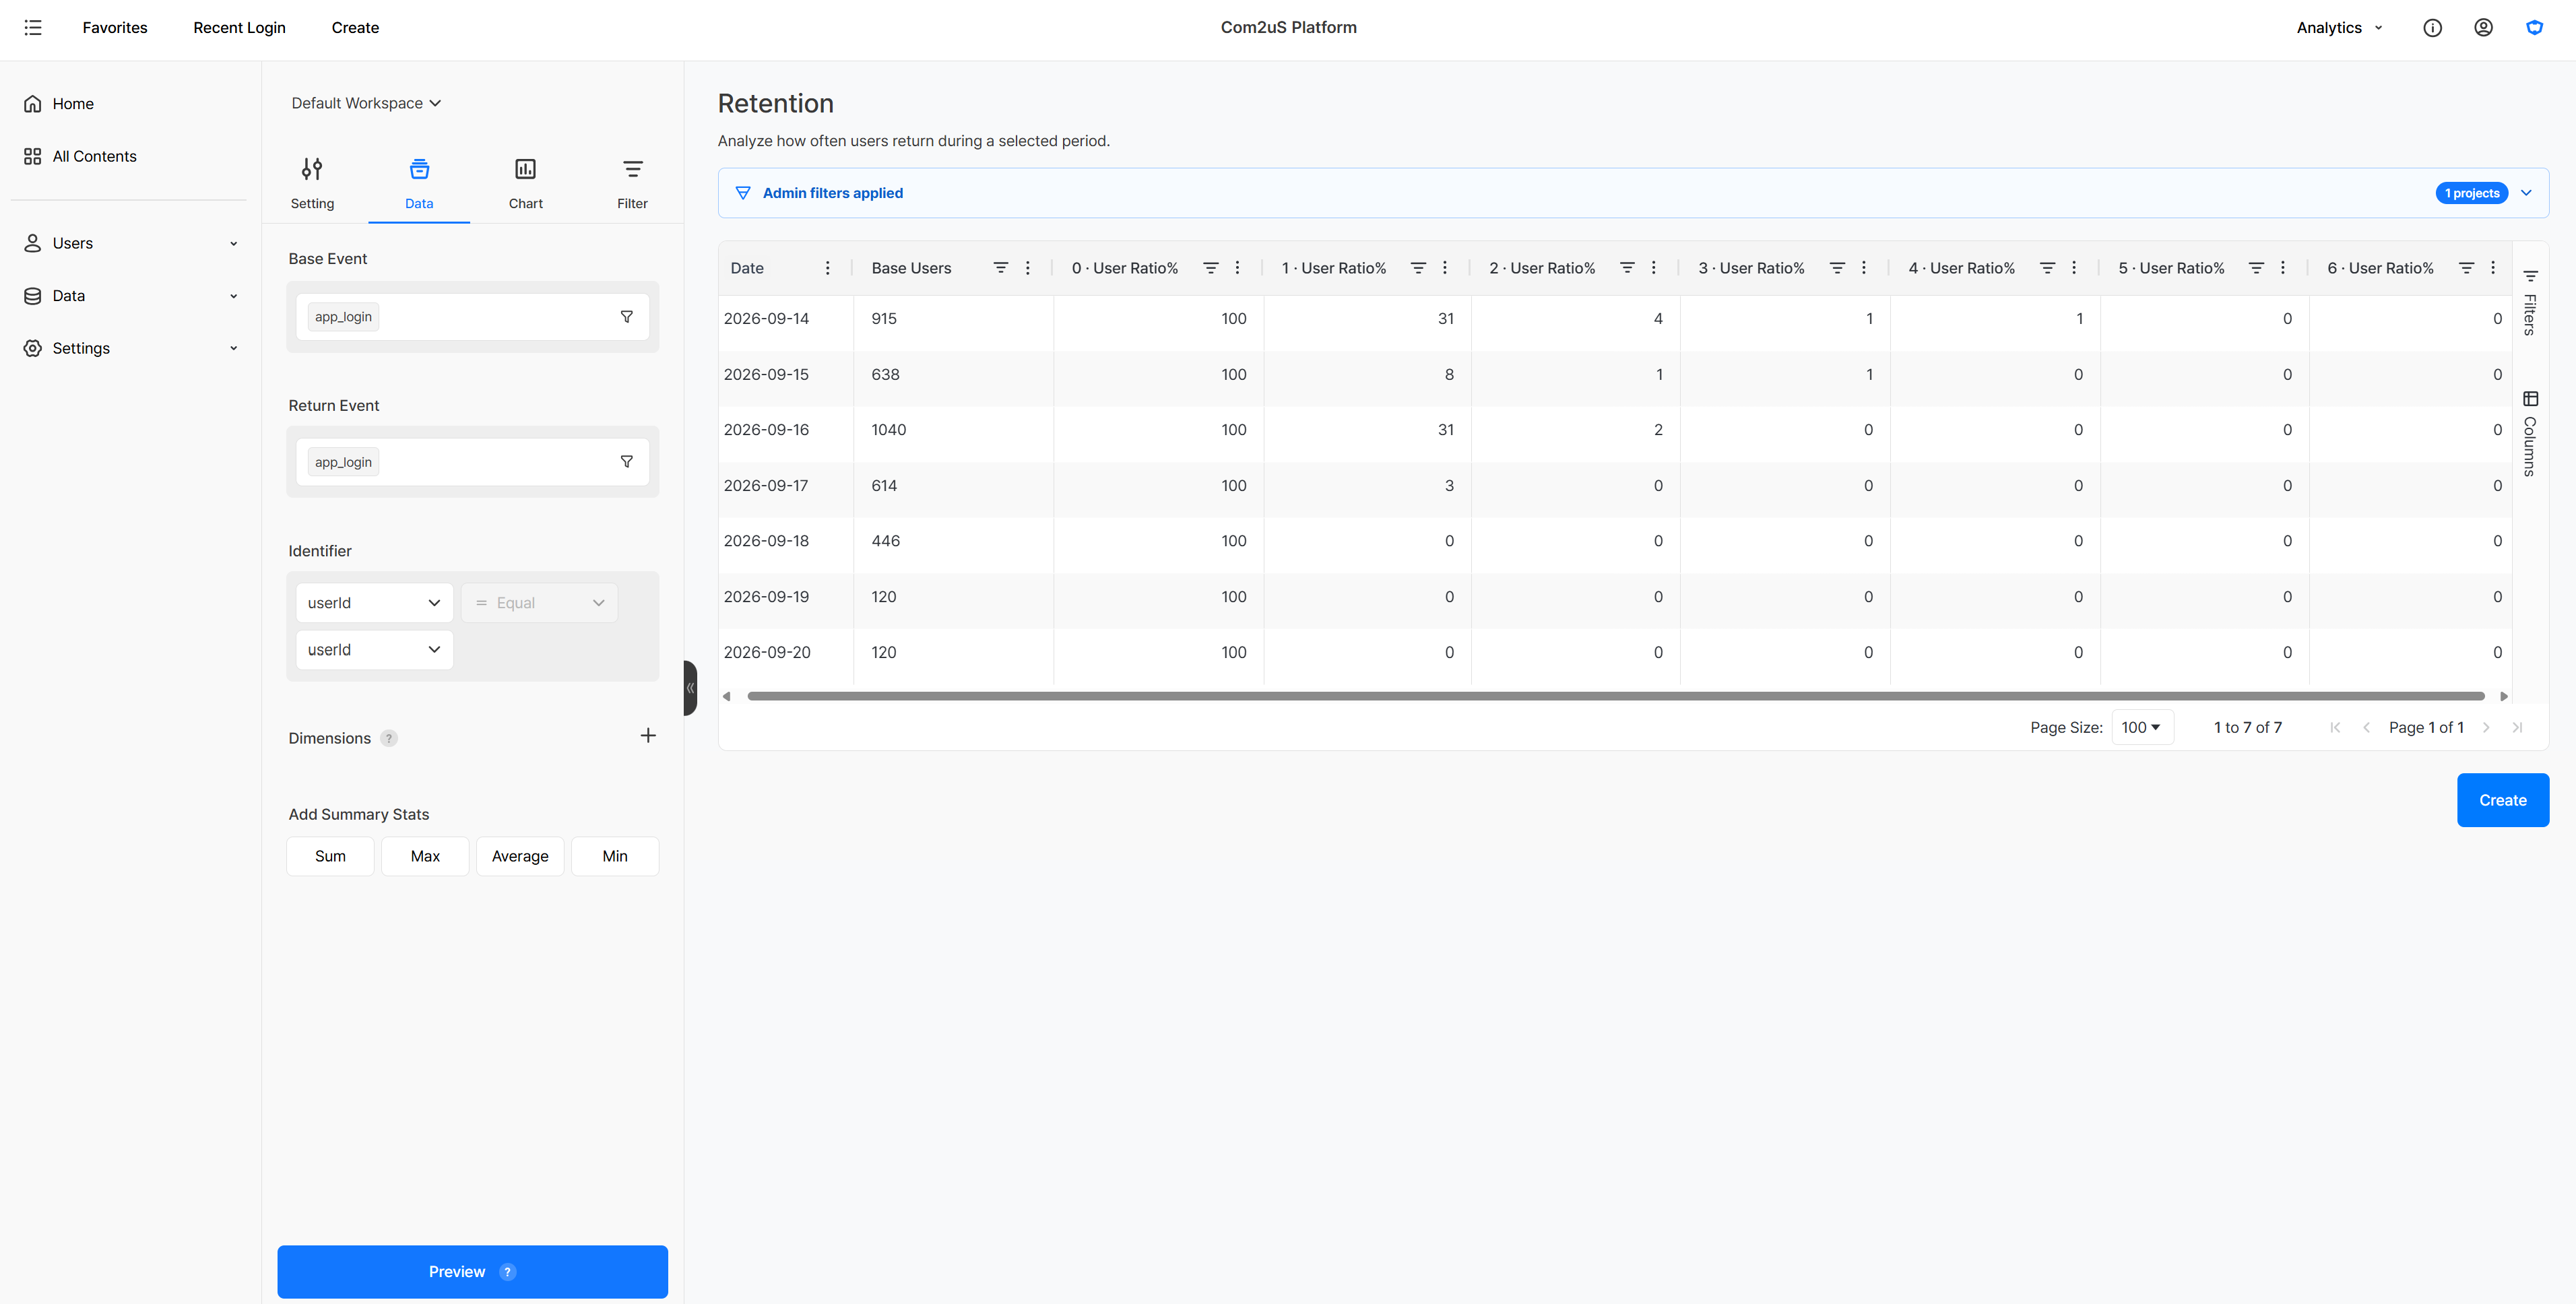
userId and the login event as both the base and return event lets you check return counts and rates by date.Try Checking Player Retention
Let's look at two approaches: narrowing down new users' return-visit change by dimension after an update, and setting different base and return events to check behavior after new content.
Checking the Return Flow of New Users
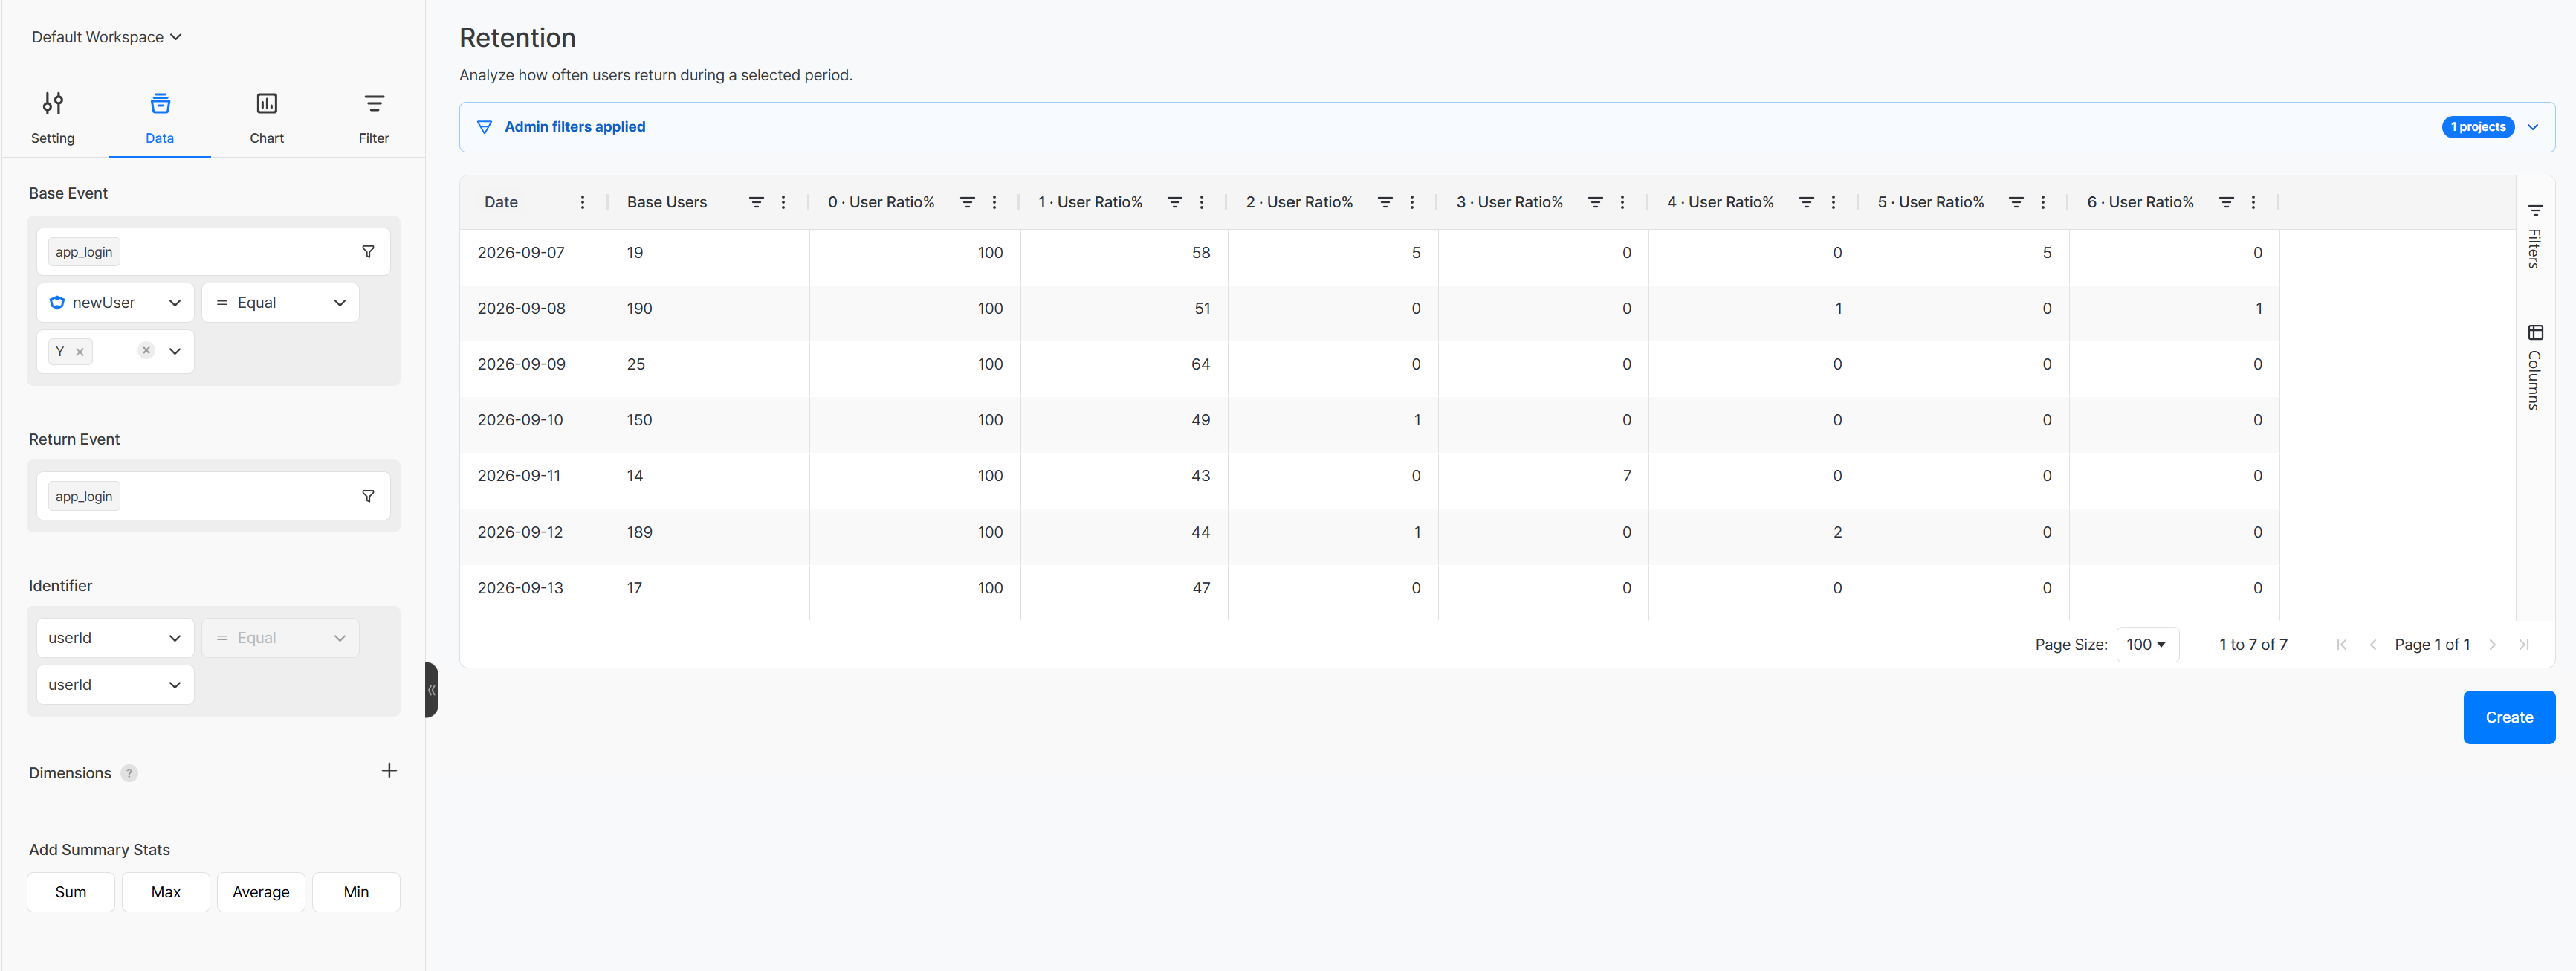
To check new users' return flow after an update, set both the base and return events to login, and apply a new-user condition to the base event. In the screen below, Day 1 retention for new users drops below 50% starting September 10, 2026.
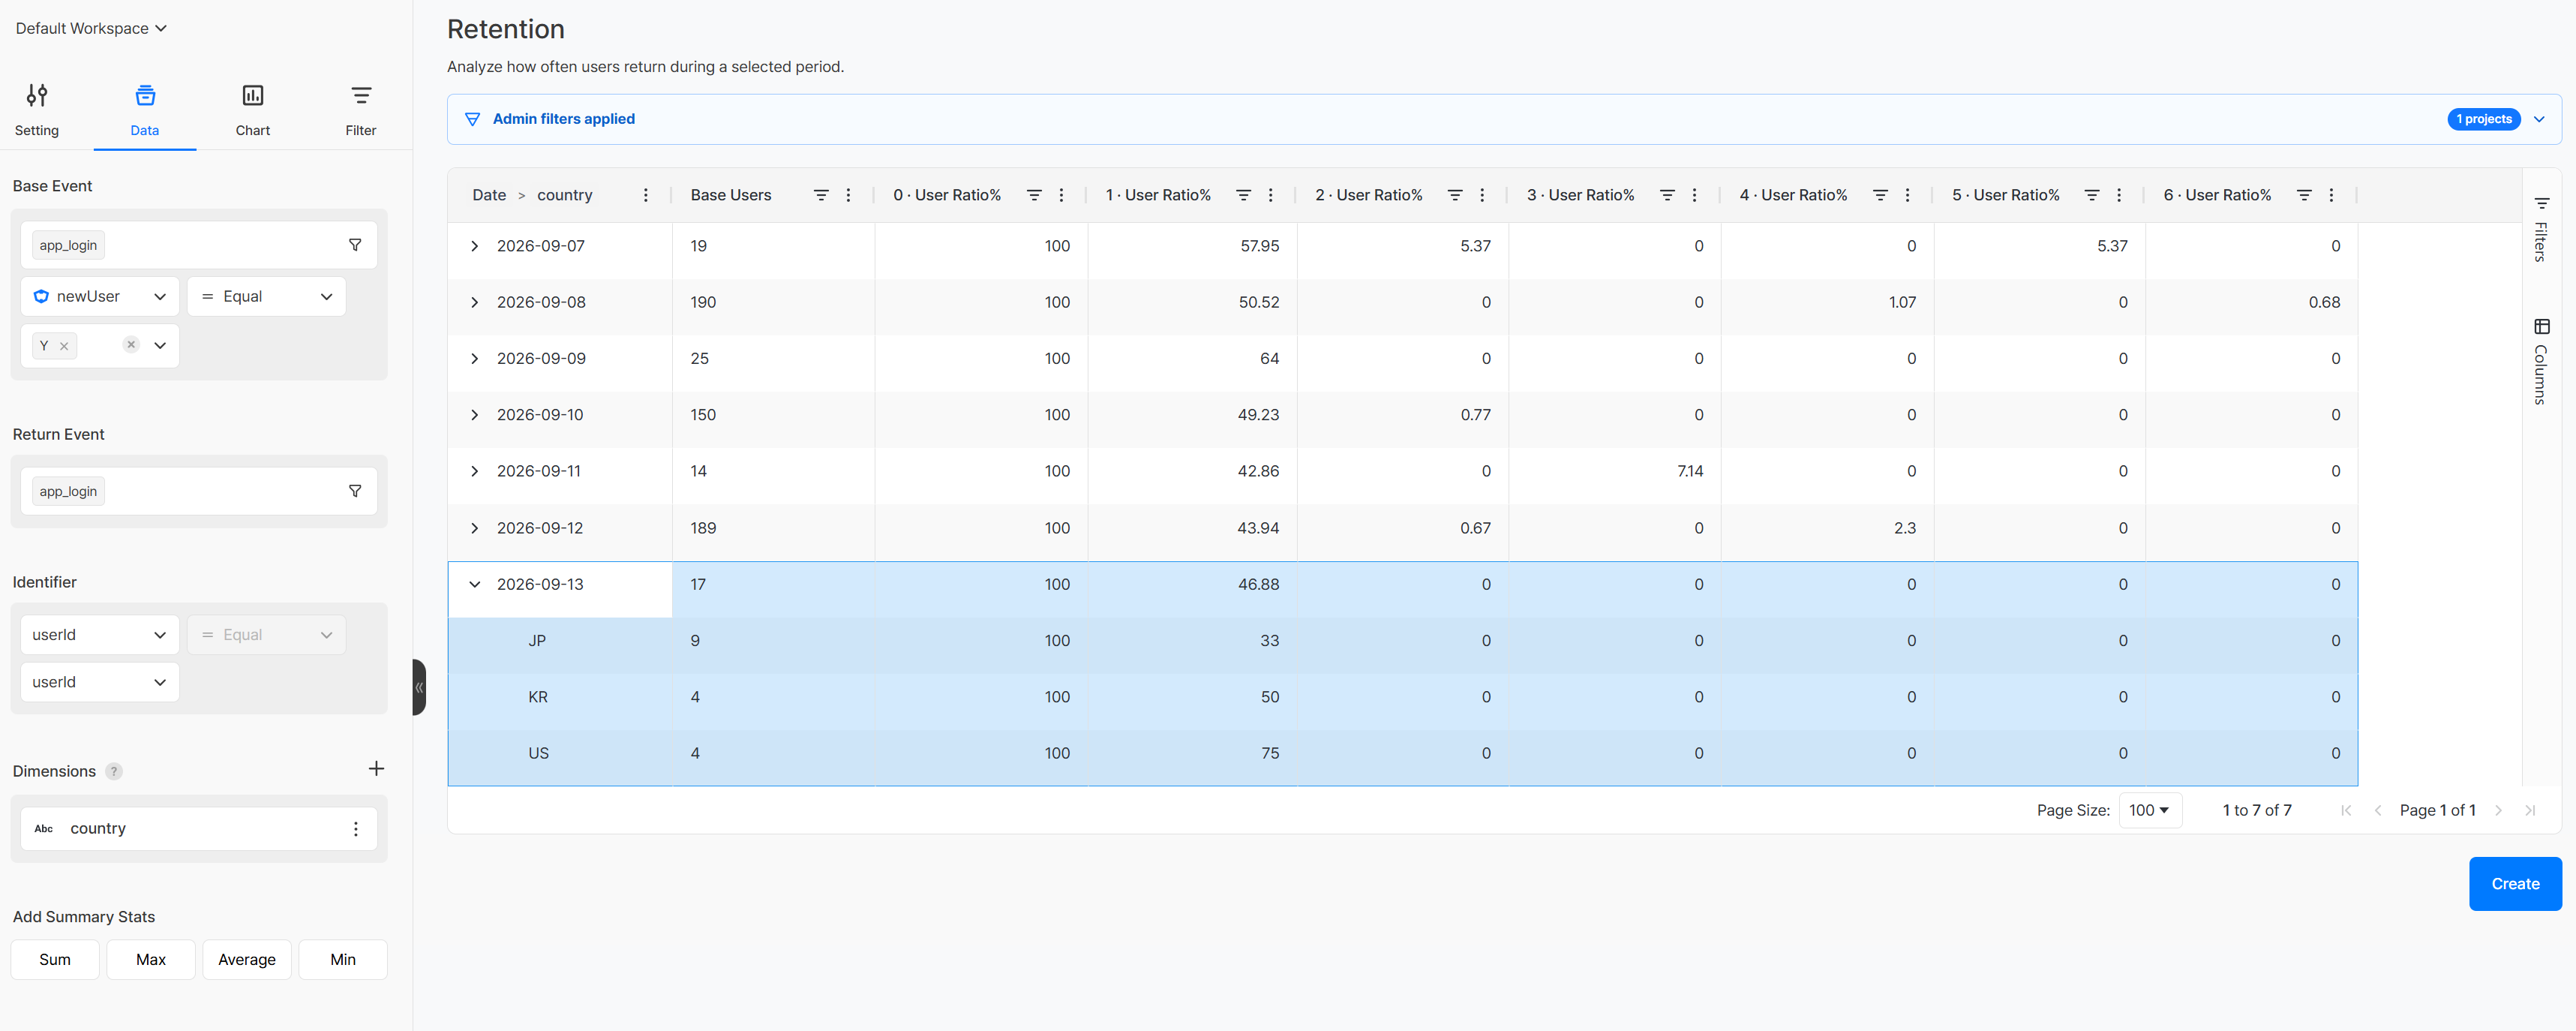
To see which user group the overall change came from, you can add a country dimension. Breaking down the September 13, 2026 results by country shows Day 1 retention at 33% for JP, 50% for KR, and 75% for US. With overall retention at 47%, you can see that JP users are comparatively lower and narrow down where to look further.
Checking Retention After New Content
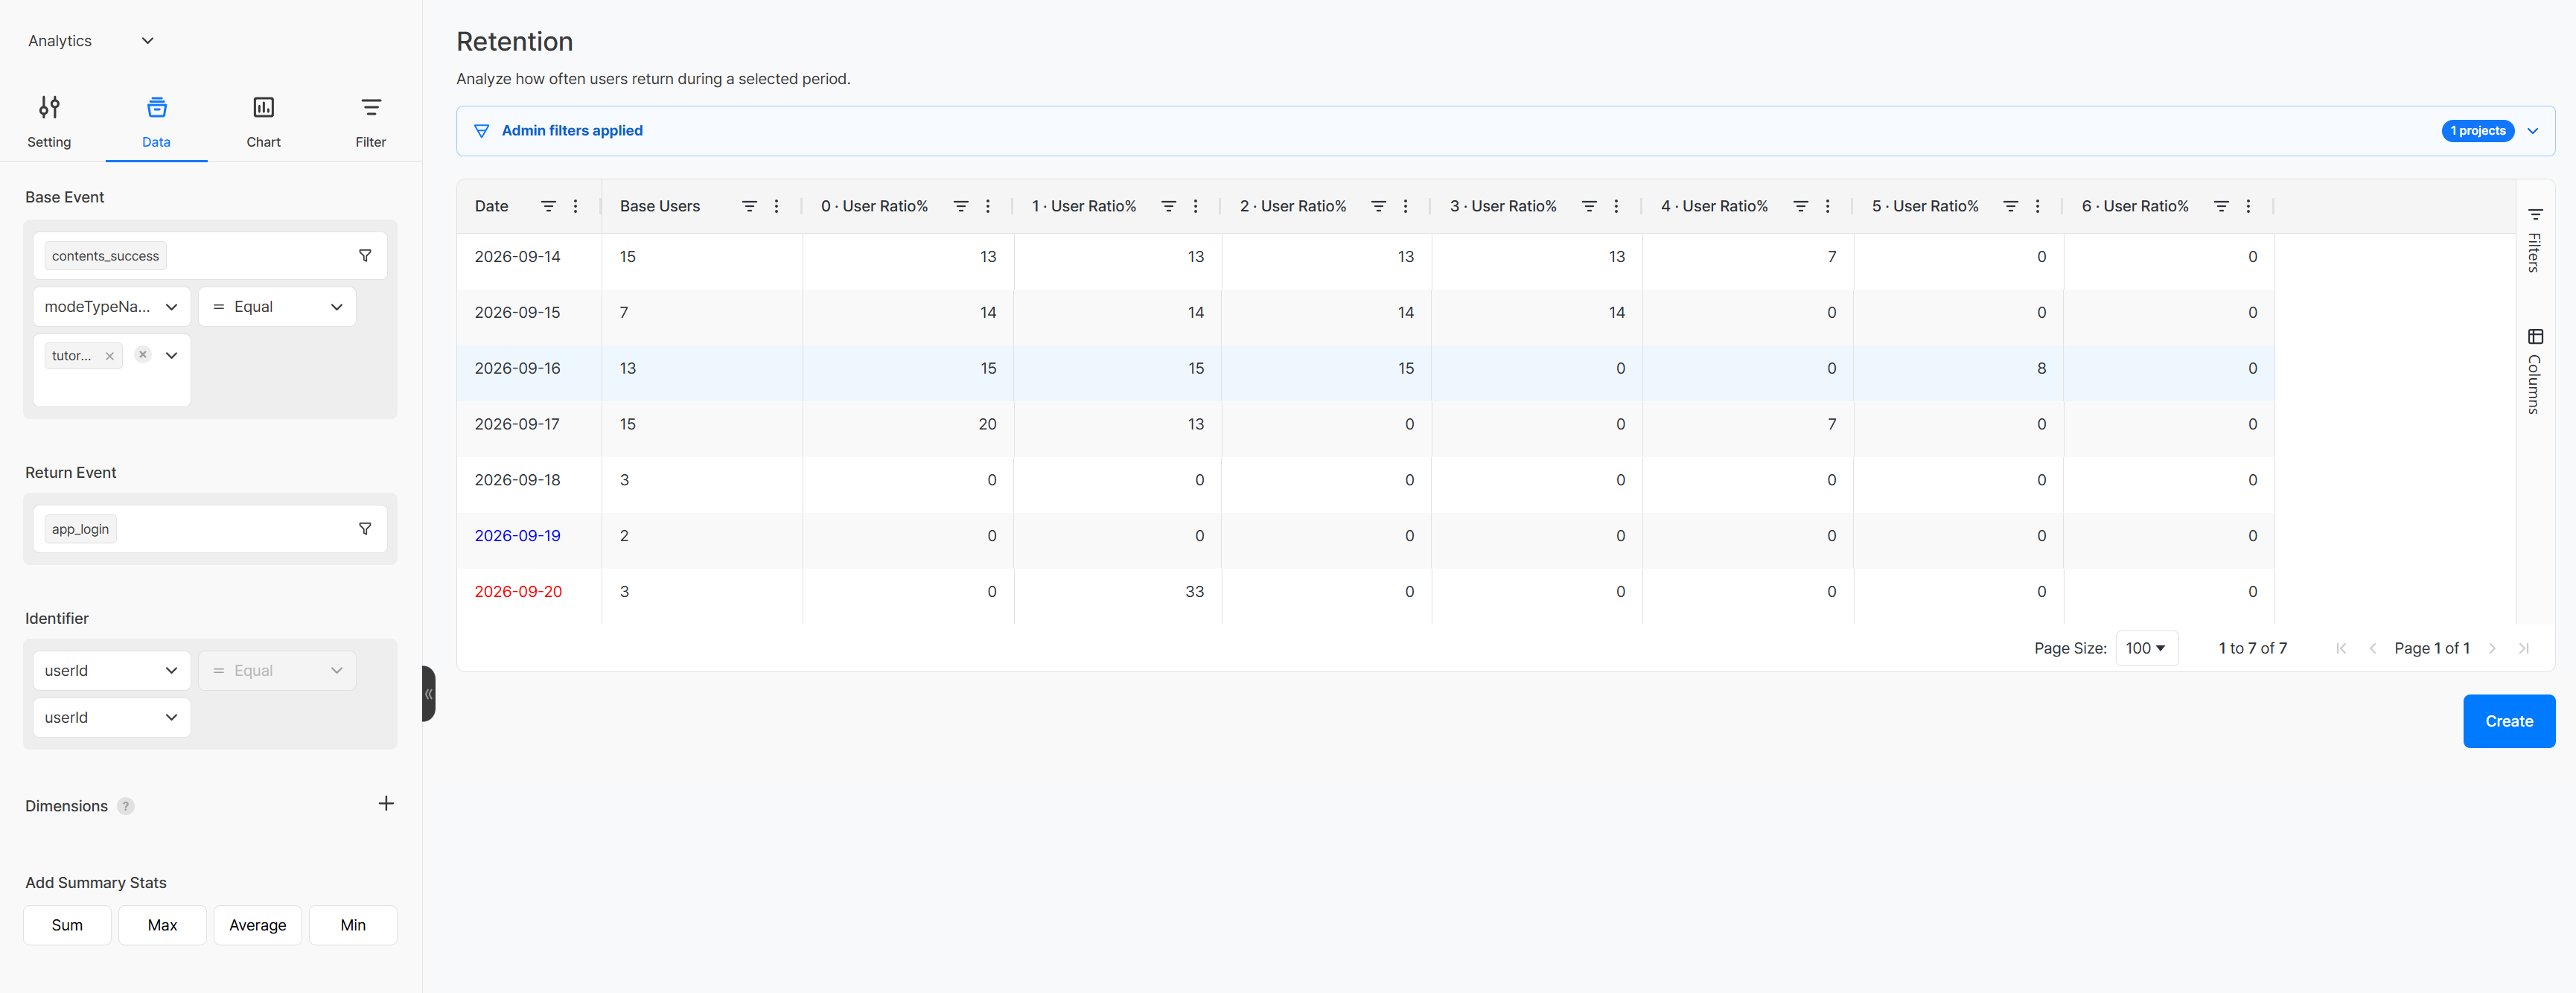
The screen below is an example of checking the return flow after content use, where content-related events were sent using the Analytics event template structure. The base event is set to contents_success with a modeTypeName = tutorial1 condition, and the return event is set to the login event, app_login.
This lets you check, by elapsed days, whether users who completed the tutorial content logged in again afterward. Retention can show not just repeats of the same event but also flows between different actions, such as returning after finishing content.
Get Started With Hive Analytics
Retention lets you check, by time-based user group, whether players who took a specific action come back or keep taking the action you want. Looking at the return and retention flow that total user counts alone can't show helps you pinpoint when and for which user group content needs improvement.
Hive Analytics is a game-focused analytics solution that groups events collected through the Hive SDK by user group and analyzes return and repeat-action flows. Set a base and return event in Hive Analytics now and check your players' retention flow.