Analyzing User Flow from Content Start to Completion
When new content is released, the first things teams tend to look at are the number of participating users and the completion count. If the start and completion numbers differ from expectations, content structure, difficulty, or rewards can be reviewed, but these two figures alone don't reveal where users stopped along the way.
Many users may start the content but fail to get past a particular step, or reach the final stage yet leave without claiming the reward. To determine whether content is being used as intended, it's necessary to look not only at the start and completion but also at what happens in between.
The Gap Between Design Intent and Actual Usage
Planners design content as a single connected experience, from entry conditions through the sequence of progress to goals and rewards. In practice, however, users may act in a different order than expected or repeatedly drop off at a specific step.
Looking only at overall participation shows the level of interest in the content, but it's difficult to distinguish problems that occur during the process. Examining which steps users pass through after starting content, on the way to completion, makes it possible to spot gaps between design intent and actual behavior and to pinpoint which segments need review.
Analyzing Content Flow in Hive Analytics
Hive Analytics provides predefined events for recording content acceptance, waiting, completion, failure, and cancellation. Once content events are sent according to the defined schema, they can be checked in the event list and used directly in charts and funnels.
Behaviors that are hard to express with content events alone, such as entry, mid-progress actions, or reward acquisition, can be freely defined and sent as custom events. Using predefined and custom events together allows common states to be managed under a consistent standard while still covering the content structure within the scope of analysis.
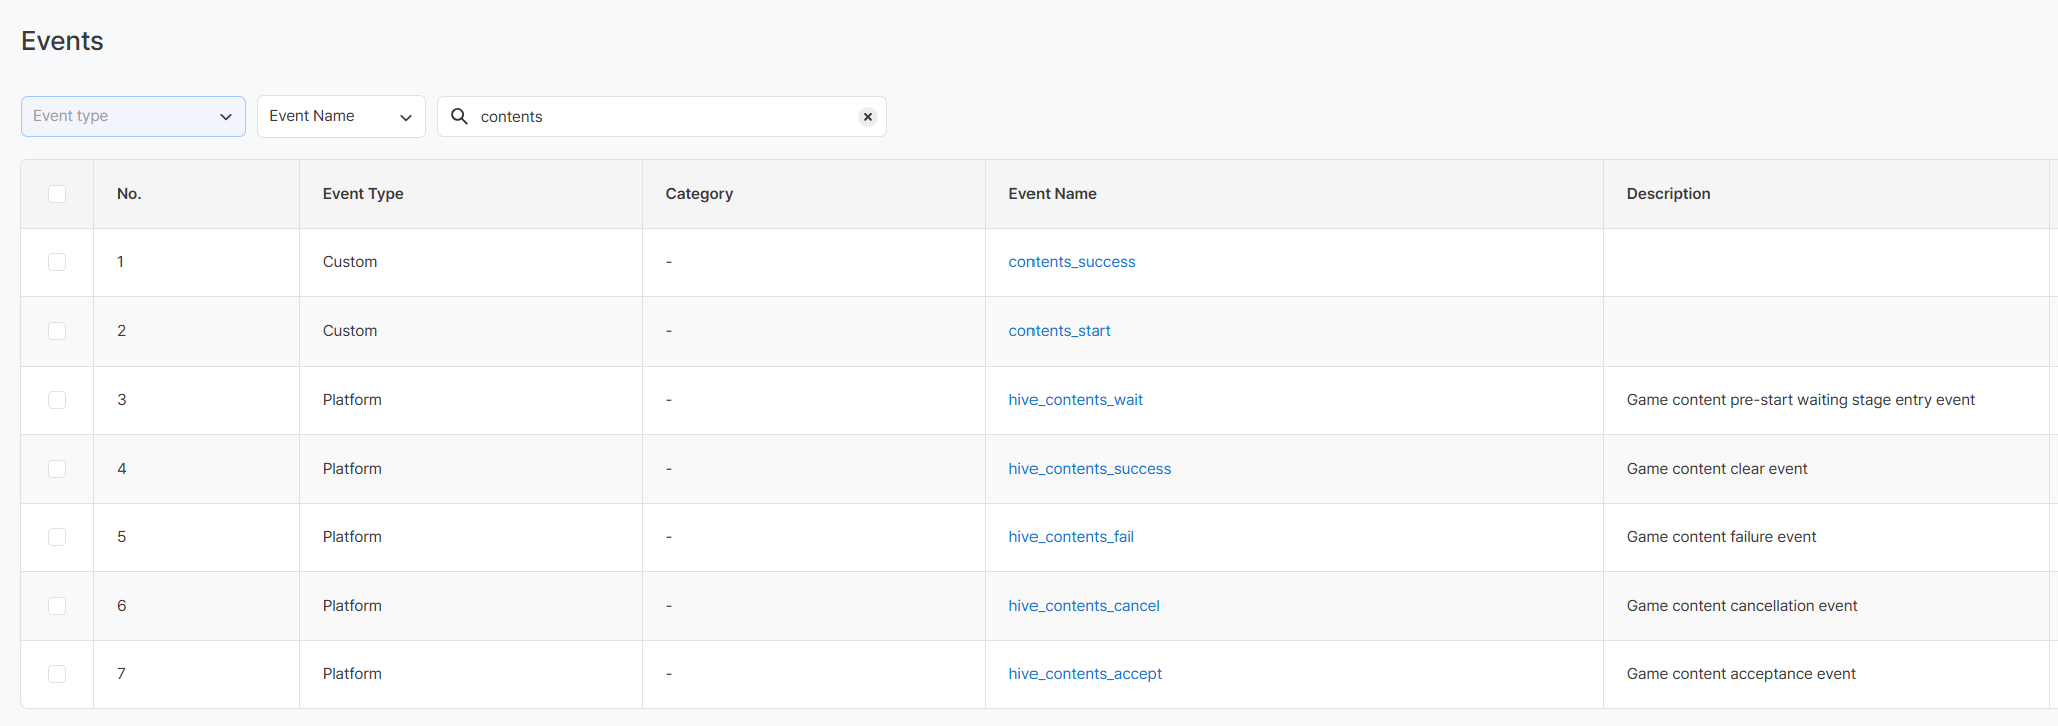
Charts can combine the number of users who accepted and completed content along with the completion rate, making it possible to compare overall participation scale and changes over time, and any point where the change stands out can then be examined further with a funnel. Connecting key actions such as content acceptance, entry, start, and completion in sequence makes it possible to check conversion and drop-off at each step.
Reviewing Usage Flow by Content Step
Content flow can be analyzed by first checking the overall scale and results in a chart, then narrowing the scope with a funnel to examine drop-off at each step.
Comparing Content Acceptance and Completion Scale
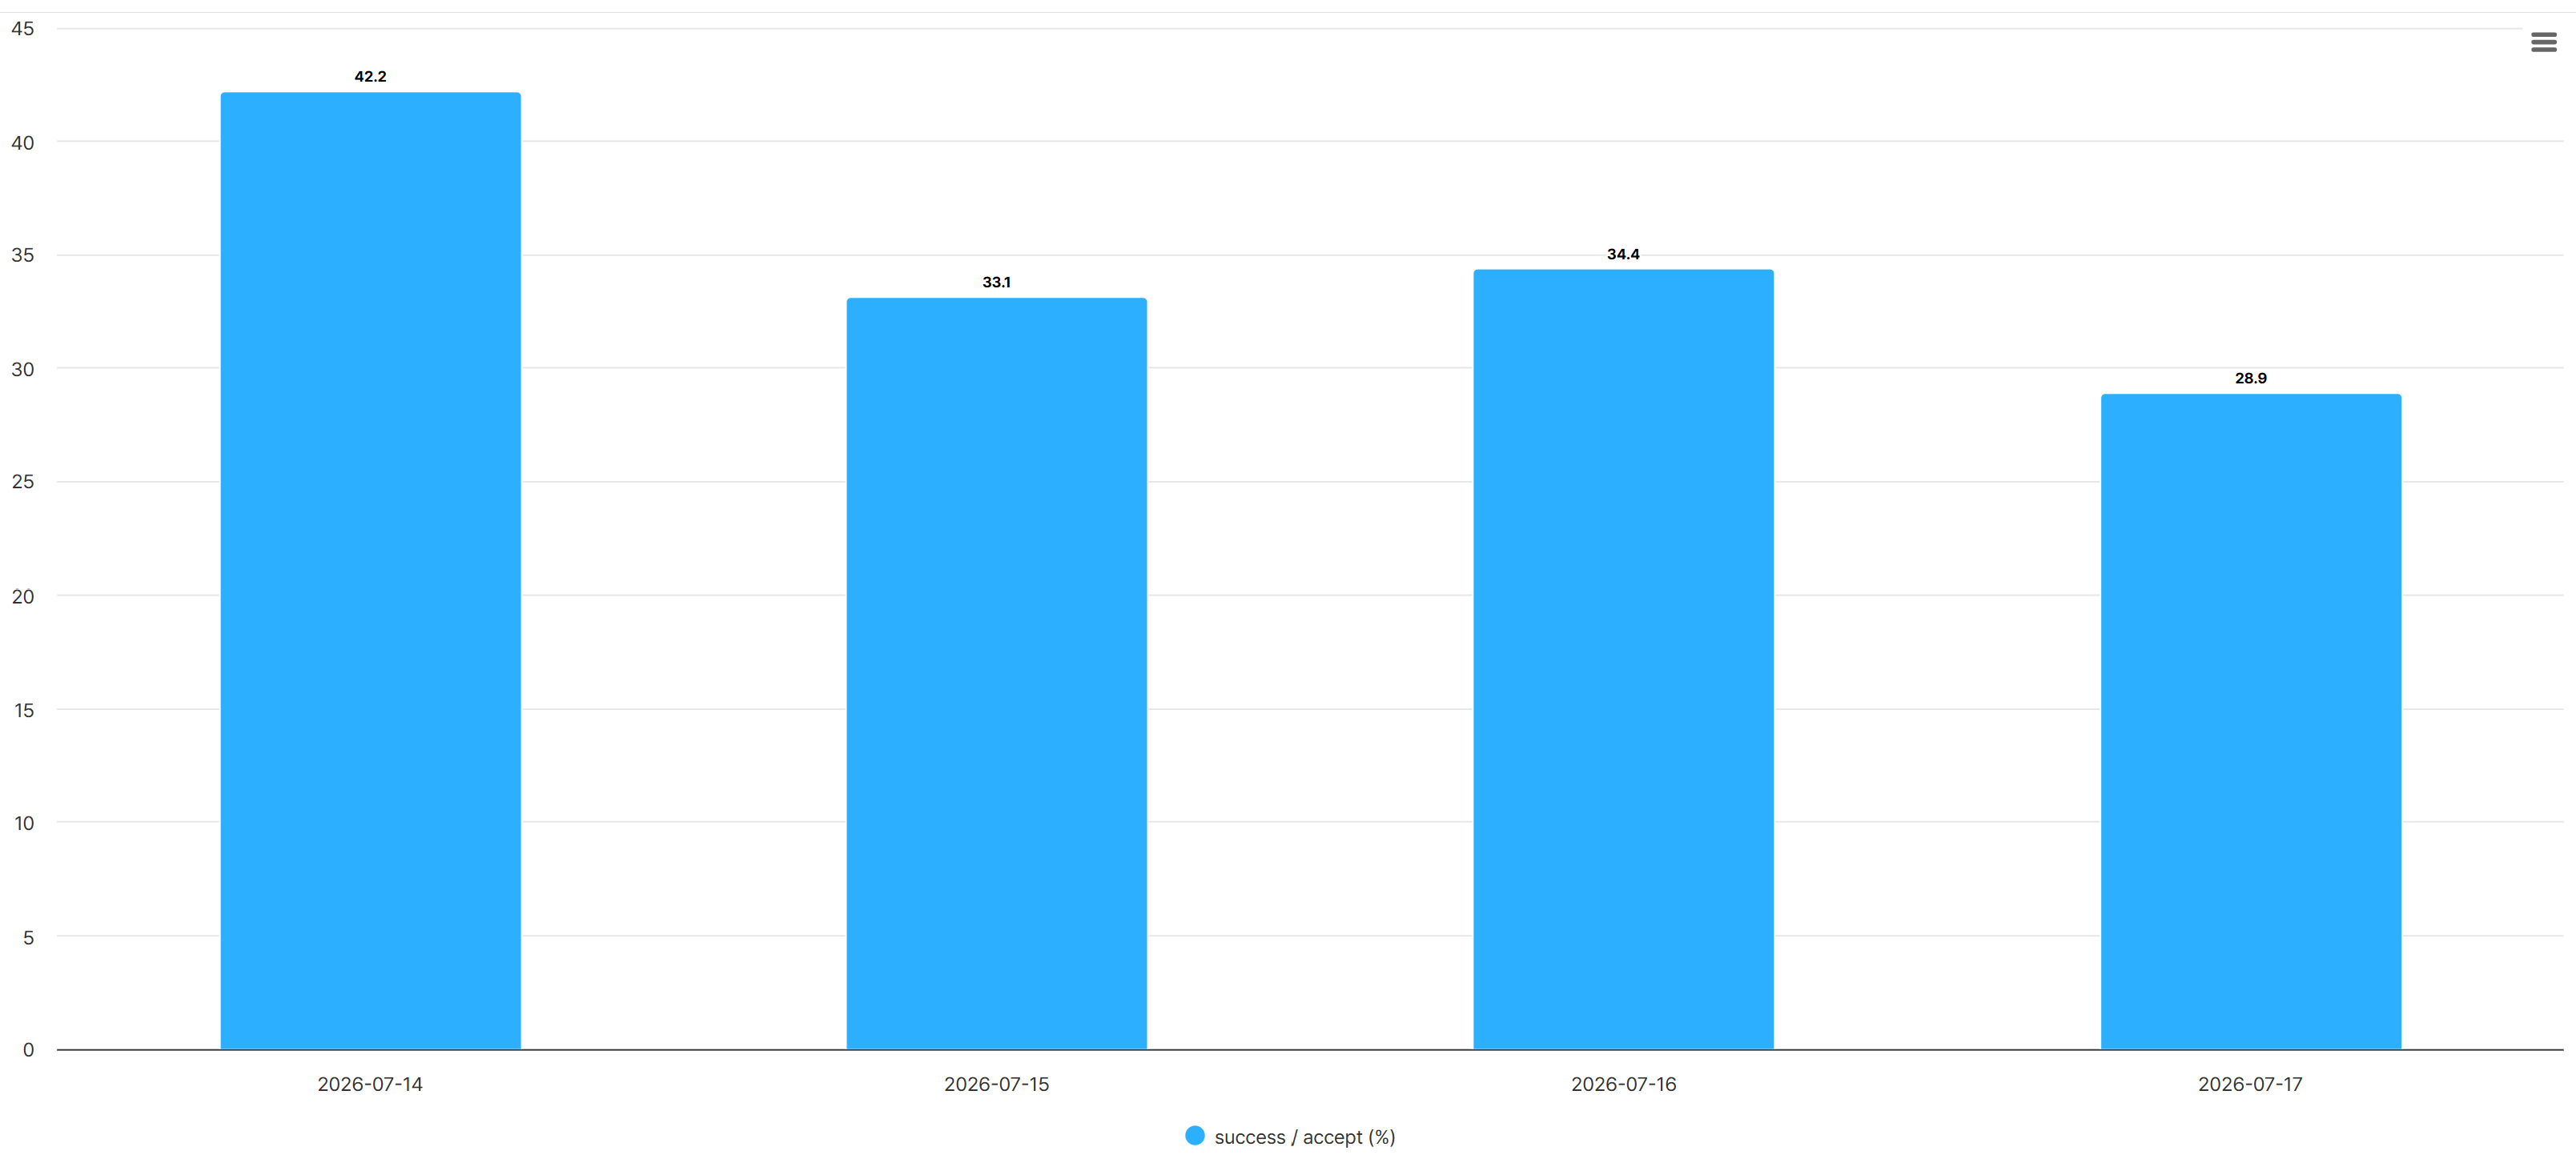
Placing the number of users who accepted content, the number who completed it, and the completion rate relative to acceptance on a single screen makes it possible to see participation scale and result changes together. As in the example screen, if the completion rate gradually falls from the 40% range down to the 20% range on a particular date, that point can be selected for further detailed analysis.
Checking Where Users Drop Off at Each Step
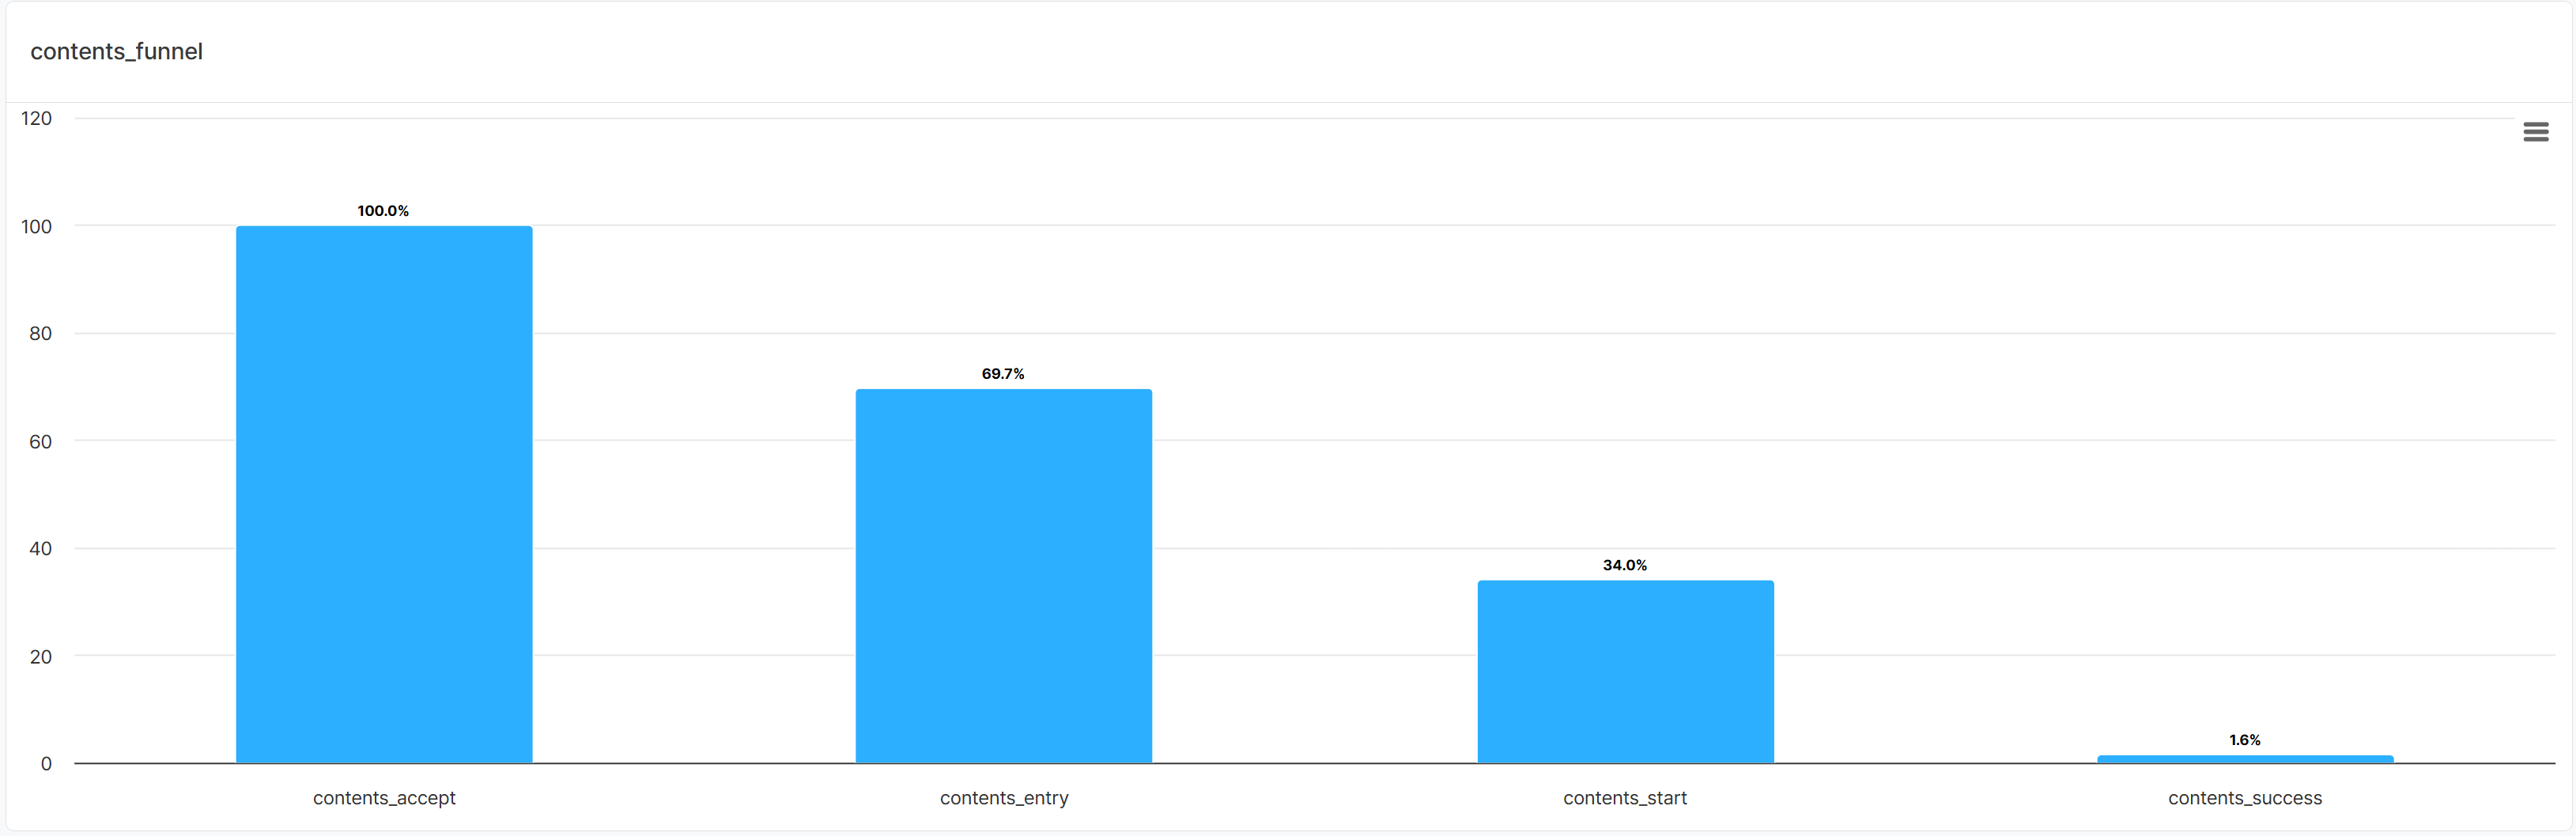
Checking the content acceptance, entry, start, and completion events for the date when the completion rate dropped, using a funnel, makes it possible to see at which step users dropped off. Applying filters for the relevant user conditions also allows a closer look at the flow for a specific segment. In the example screen, 69.7% of users who accepted the content entered, and 34.0% started, but only 1.6% reached completion. Since the drop is especially large between the start and completion steps, this narrows down the priority areas for review, such as completion conditions, difficulty, and progress guidance.
Rather than concluding the cause of drop-off from chart and funnel results alone, they can be used as a basis for comparing conditions such as content type, difficulty, and user level to find where the differences stand out most.
Checking Conversion Changes After Improvement
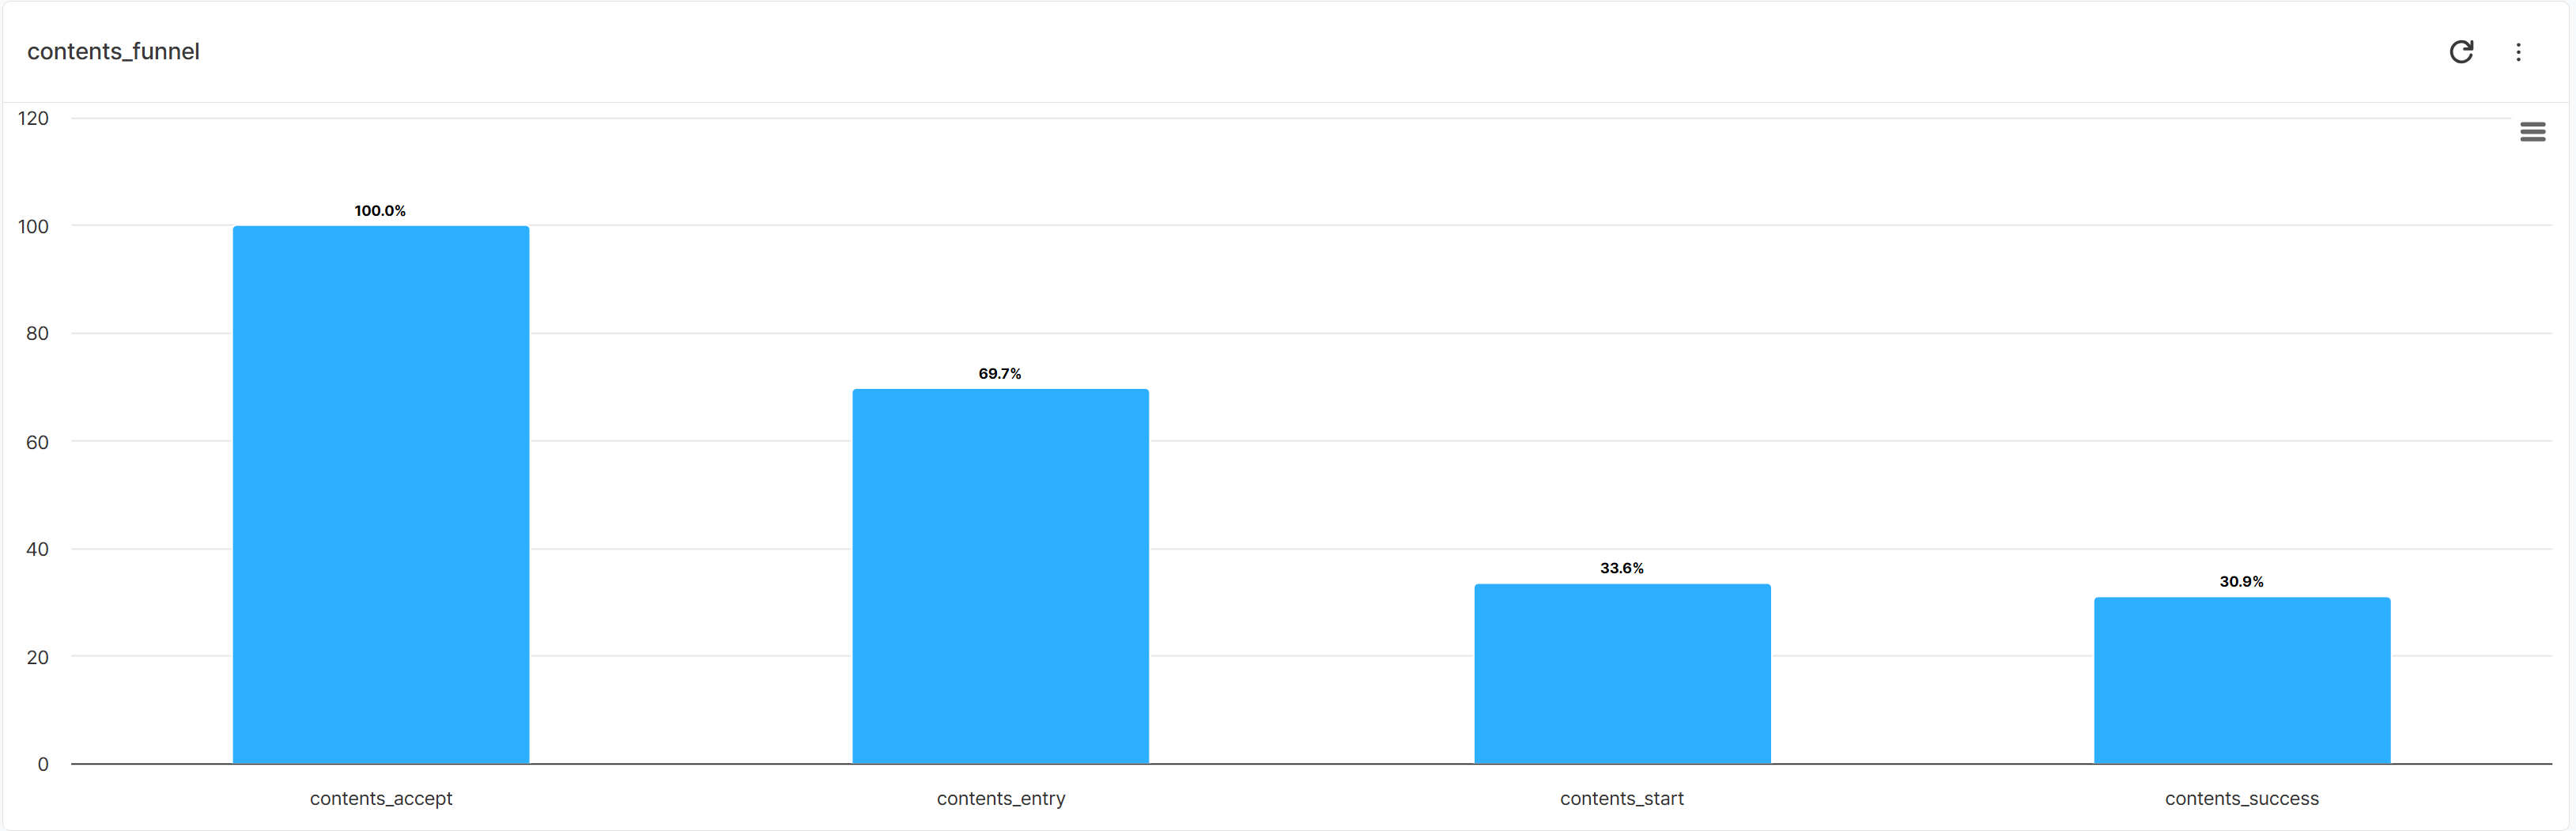
After adjusting completion conditions or difficulty, checking the funnel again with the same steps and filters makes it possible to compare changes before and after the improvement. In the example screen, the reach rates for the acceptance, entry, and start steps are similar to before, but the completion rate rose from 1.6% to 30.9%. This makes it possible to see whether drop-off at the completion step decreased after the change and to judge which segments may still need further improvement.
Getting Started with Hive Analytics
Start by checking whether events representing content acceptance, progress, and completion are being collected for the content you want to analyze. Send predefined content events according to the schema, and extend coverage with custom events and properties for any game-specific behaviors that need additional tracking.
Hive Analytics is a game-focused analytics solution that lets you freely send custom events through the Hive SDK, and lets you use charts and funnels to analyze usage flow and step-by-step conversion and drop-off, from content acceptance to completion, right away. Explore your content usage scale and step-by-step flow now with Hive Analytics, and use the gap between design intent and actual usage behavior to inform your improvement decisions.