Building the Metrics You Need with Multiple Calculations
In Hive Analytics charts, you apply a primary calculation to events and properties to build a measure, then use a secondary calculation to recalculate the maximum, minimum, average, or latest value of the results at each interval. This lets you build metrics in a chart that a single aggregation can't give you, such as monthly average daily AU or today's peak concurrent users.
Game Metrics That a Single Aggregation Can't Show
Games continuously generate a wide range of events, such as logins, purchases, and content play. By counting how often a selected event occurs or calculating the distinct count, sum, or average of property values, you can check basic metrics that come straight from events and properties, such as purchase count, number of users who logged in, and total revenue.
However, not every analysis question can be answered with a single aggregation. Concurrent users, for example, change constantly over time, so a single number can't show how logins flowed throughout the day. If you first calculate the users who logged in every 2 minutes with COUNT DISTINCT, you can see the concurrent users for each 2-minute interval. To find the highest concurrent user count of the day, apply MAX to the results calculated every 2 minutes and summarize it as the peak concurrent users for that date. As this shows, depending on the metric you want to analyze, you need to set not only the event and property but also the time interval and the calculation steps.
Chart Calculations and Secondary Calculations in Hive Analytics
In Hive Analytics charts, you can build the measure you need by selecting an event, a property, and a calculation method. The primary calculation method determines how the selected event or property values are calculated.
Primary calculation methods
| Primary calculation | Applicable property type | Description |
|---|---|---|
COUNT | Text, numeric | Counts the total number of times the event occurred. |
COUNT DISTINCT | Text, numeric | Counts the number of unique property values, excluding duplicates. |
SUM | Numeric | Adds up all property values. |
AVG | Numeric | Calculates the average of property values. |
MIN | Numeric | Returns the smallest property value. |
MAX | Numeric | Returns the largest property value. |
MAX BY | Numeric | Returns the most recent or last state value. |
Adding a secondary calculation recalculates the primary results computed at a fixed time interval so you can view them by period, such as daily, weekly, or monthly. Set the time unit and interval for the primary calculation, then choose a secondary calculation method that fits your analysis.
Secondary calculation methods
| Secondary calculation | Description |
|---|---|
MAX | Returns the largest of the primary results at each interval. |
MIN | Returns the smallest of the primary results at each interval. |
AVG | Calculates the average of the primary results at each interval. |
LAST | Returns the latest of the primary results at each interval. |
The time unit and interval set in the secondary calculation define the basis on which the primary calculation runs. The period on the Settings tab is the unit in which the interval-level primary results are grouped again and shown as the final result. Depending on the secondary calculation method you choose, you can see the maximum, minimum, average, or latest value of the interval results.
For example, if you set the chart period to monthly and apply only COUNT DISTINCT to userId of the app_login event, you get monthly active users, counting each user who logged in during the month once. Under the same conditions, if you set the primary calculation unit to day and the secondary calculation method to AVG, the average of the daily active users (AU) is shown by month. This way, you can build metrics with different calculation bases, such as monthly AU and monthly average daily AU, to suit your purpose.
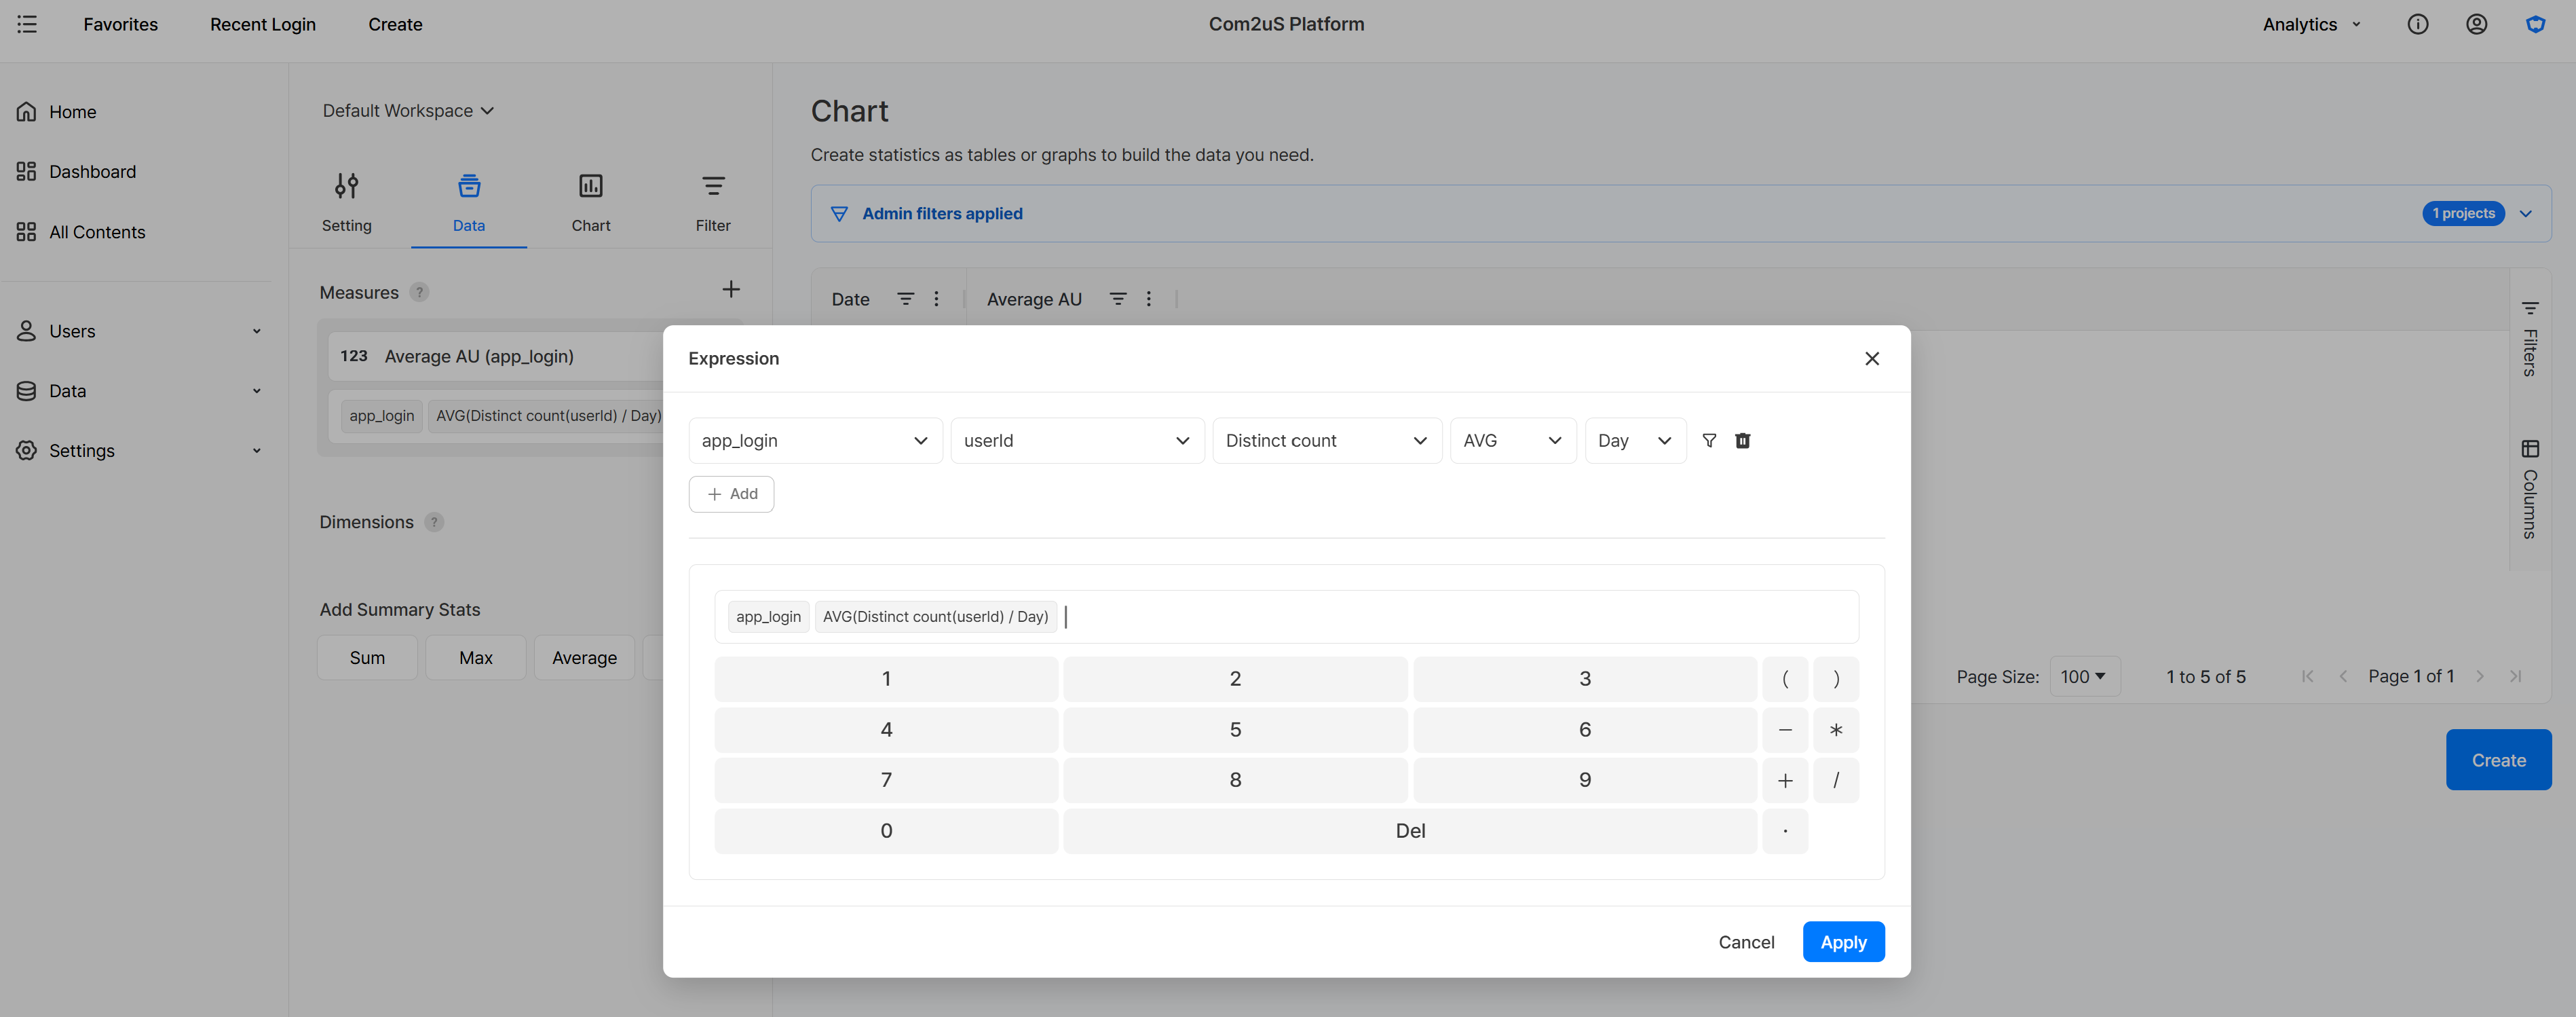
AVG secondary calculation to daily AU shows the monthly average daily AU.Checking Concurrent Users by Time and Their Peak
To look at the scale of logins in your game, first set the chart period to daily and the date to today. Select userId of the app_session_maintain event and apply the COUNT DISTINCT calculation with a 2-minute interval, and you can see the number of users logged in today every 2 minutes, excluding duplicates.
Note
app_session_maintainis an event that fires every 2 minutes while the client is running after login, and it can be used to build metrics such as concurrent users, session count, and play time. However, if you use the Minimize network communication feature in the Hive Console, concurrent user information is not sent, so check that setting and whether the event is being collected before you analyze.
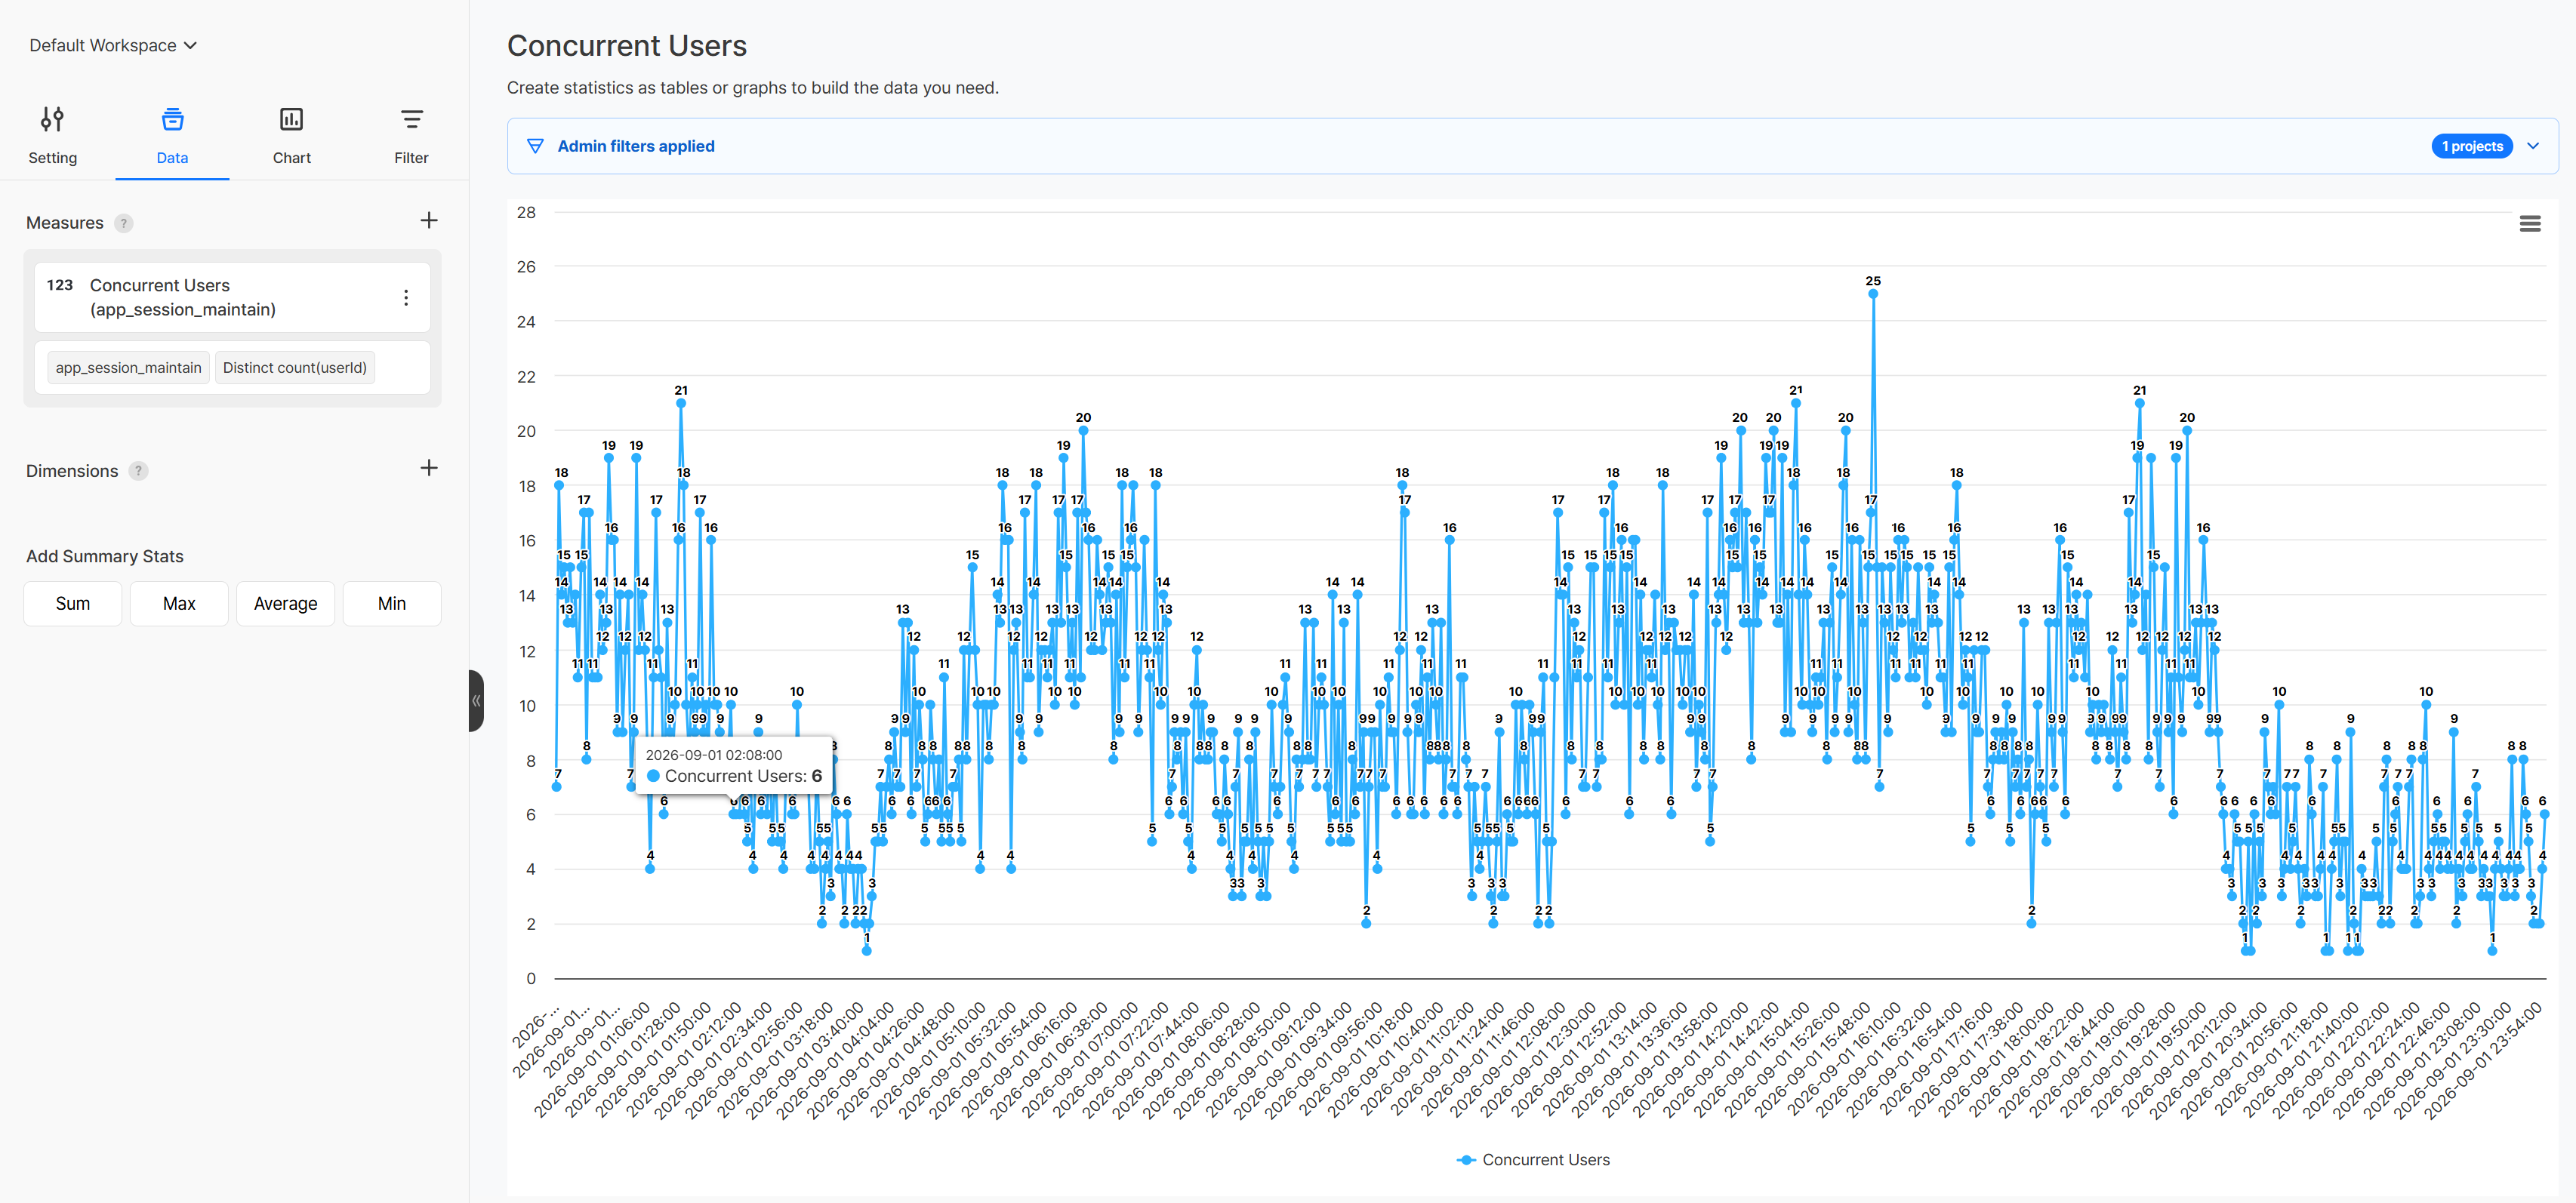
COUNT DISTINCT calculation shows how concurrent users change every 2 minutes.To see today's highest number as well, add a secondary calculation to the same event and primary calculation. Set the time unit to minute and the interval to 2 minutes, and choose MAX as the secondary calculation method. With the chart period set to daily and the date to today, the largest of the 2-minute concurrent user counts is shown as the peak concurrent users up to the time of the query.
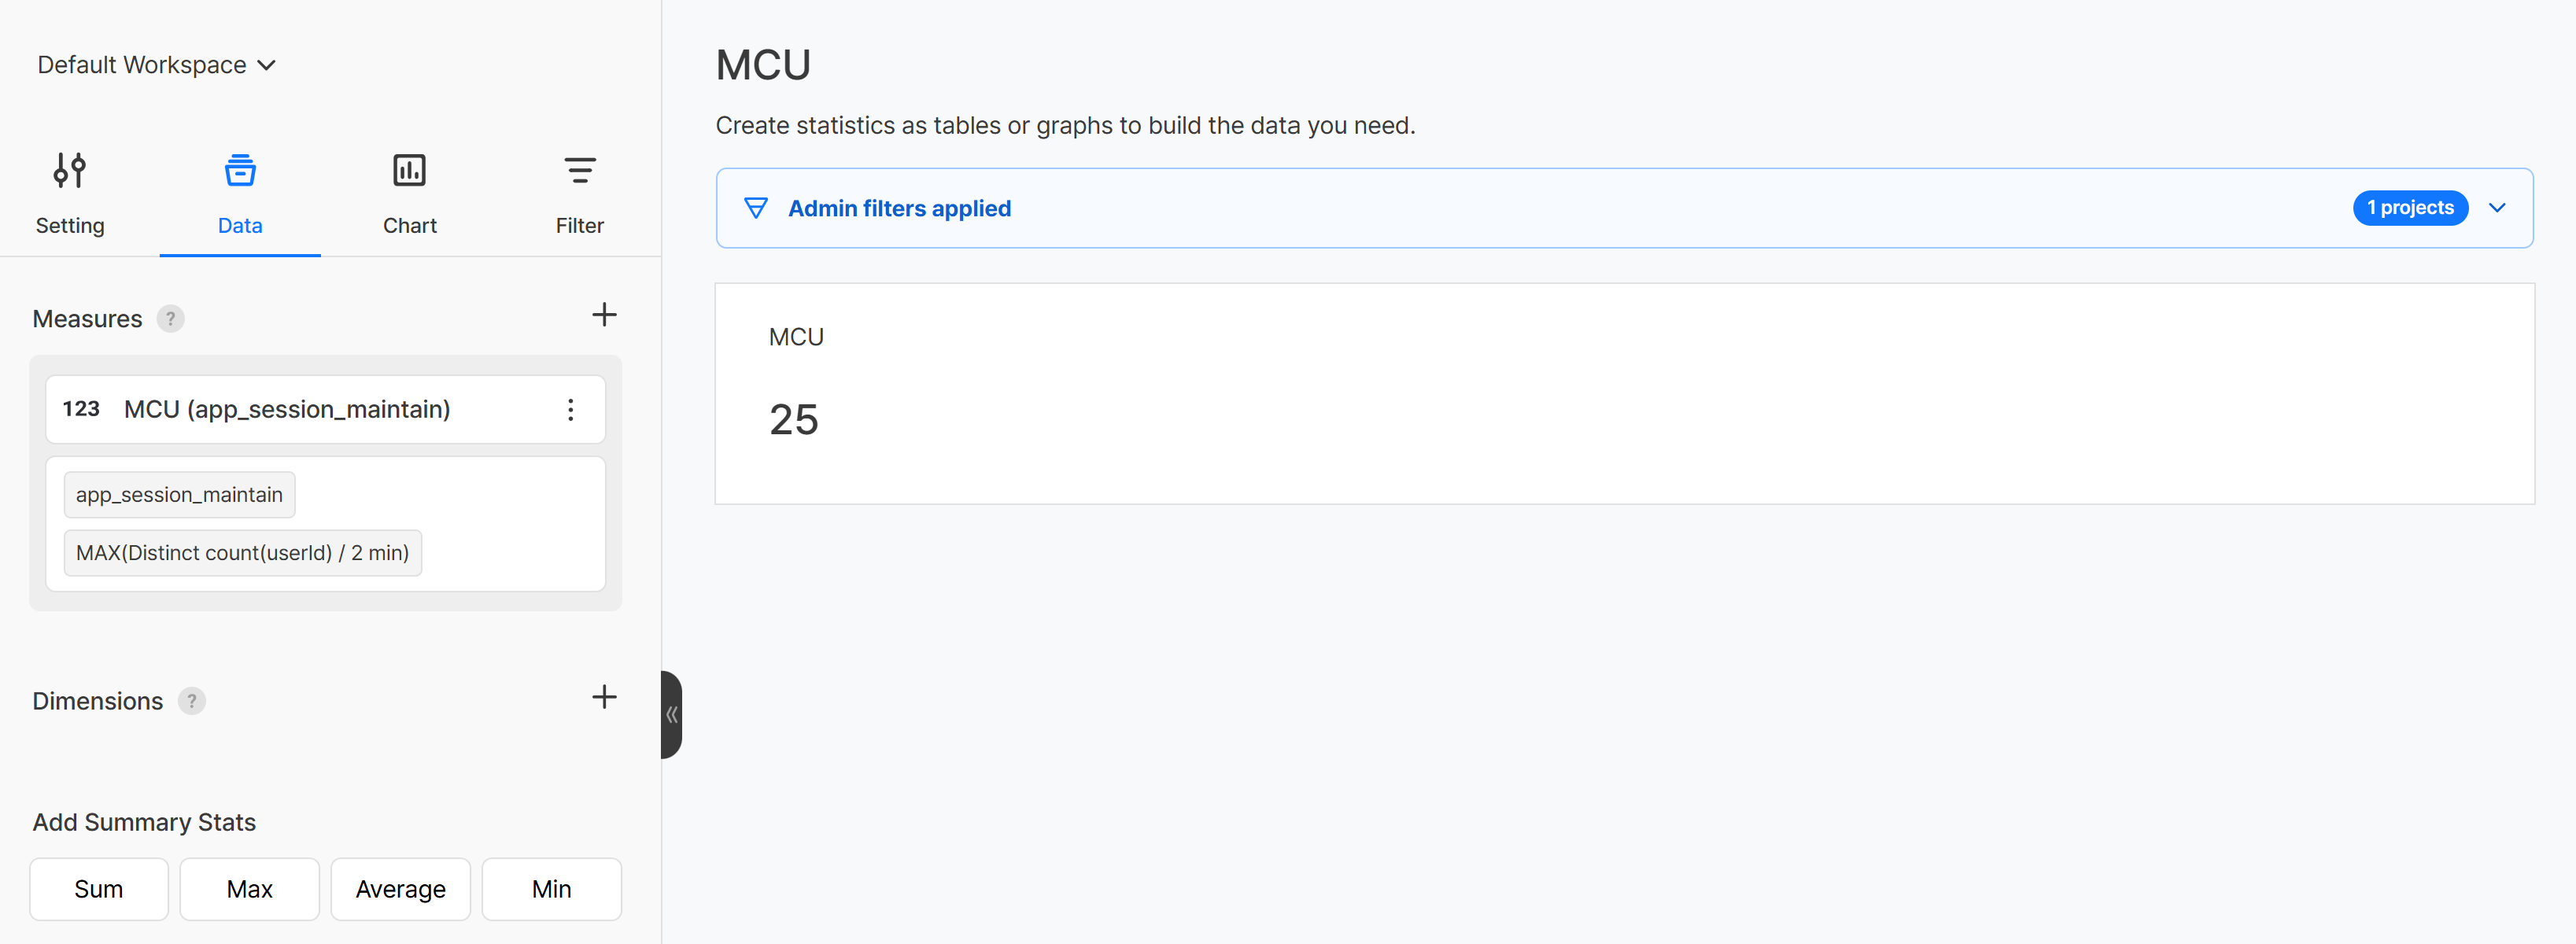
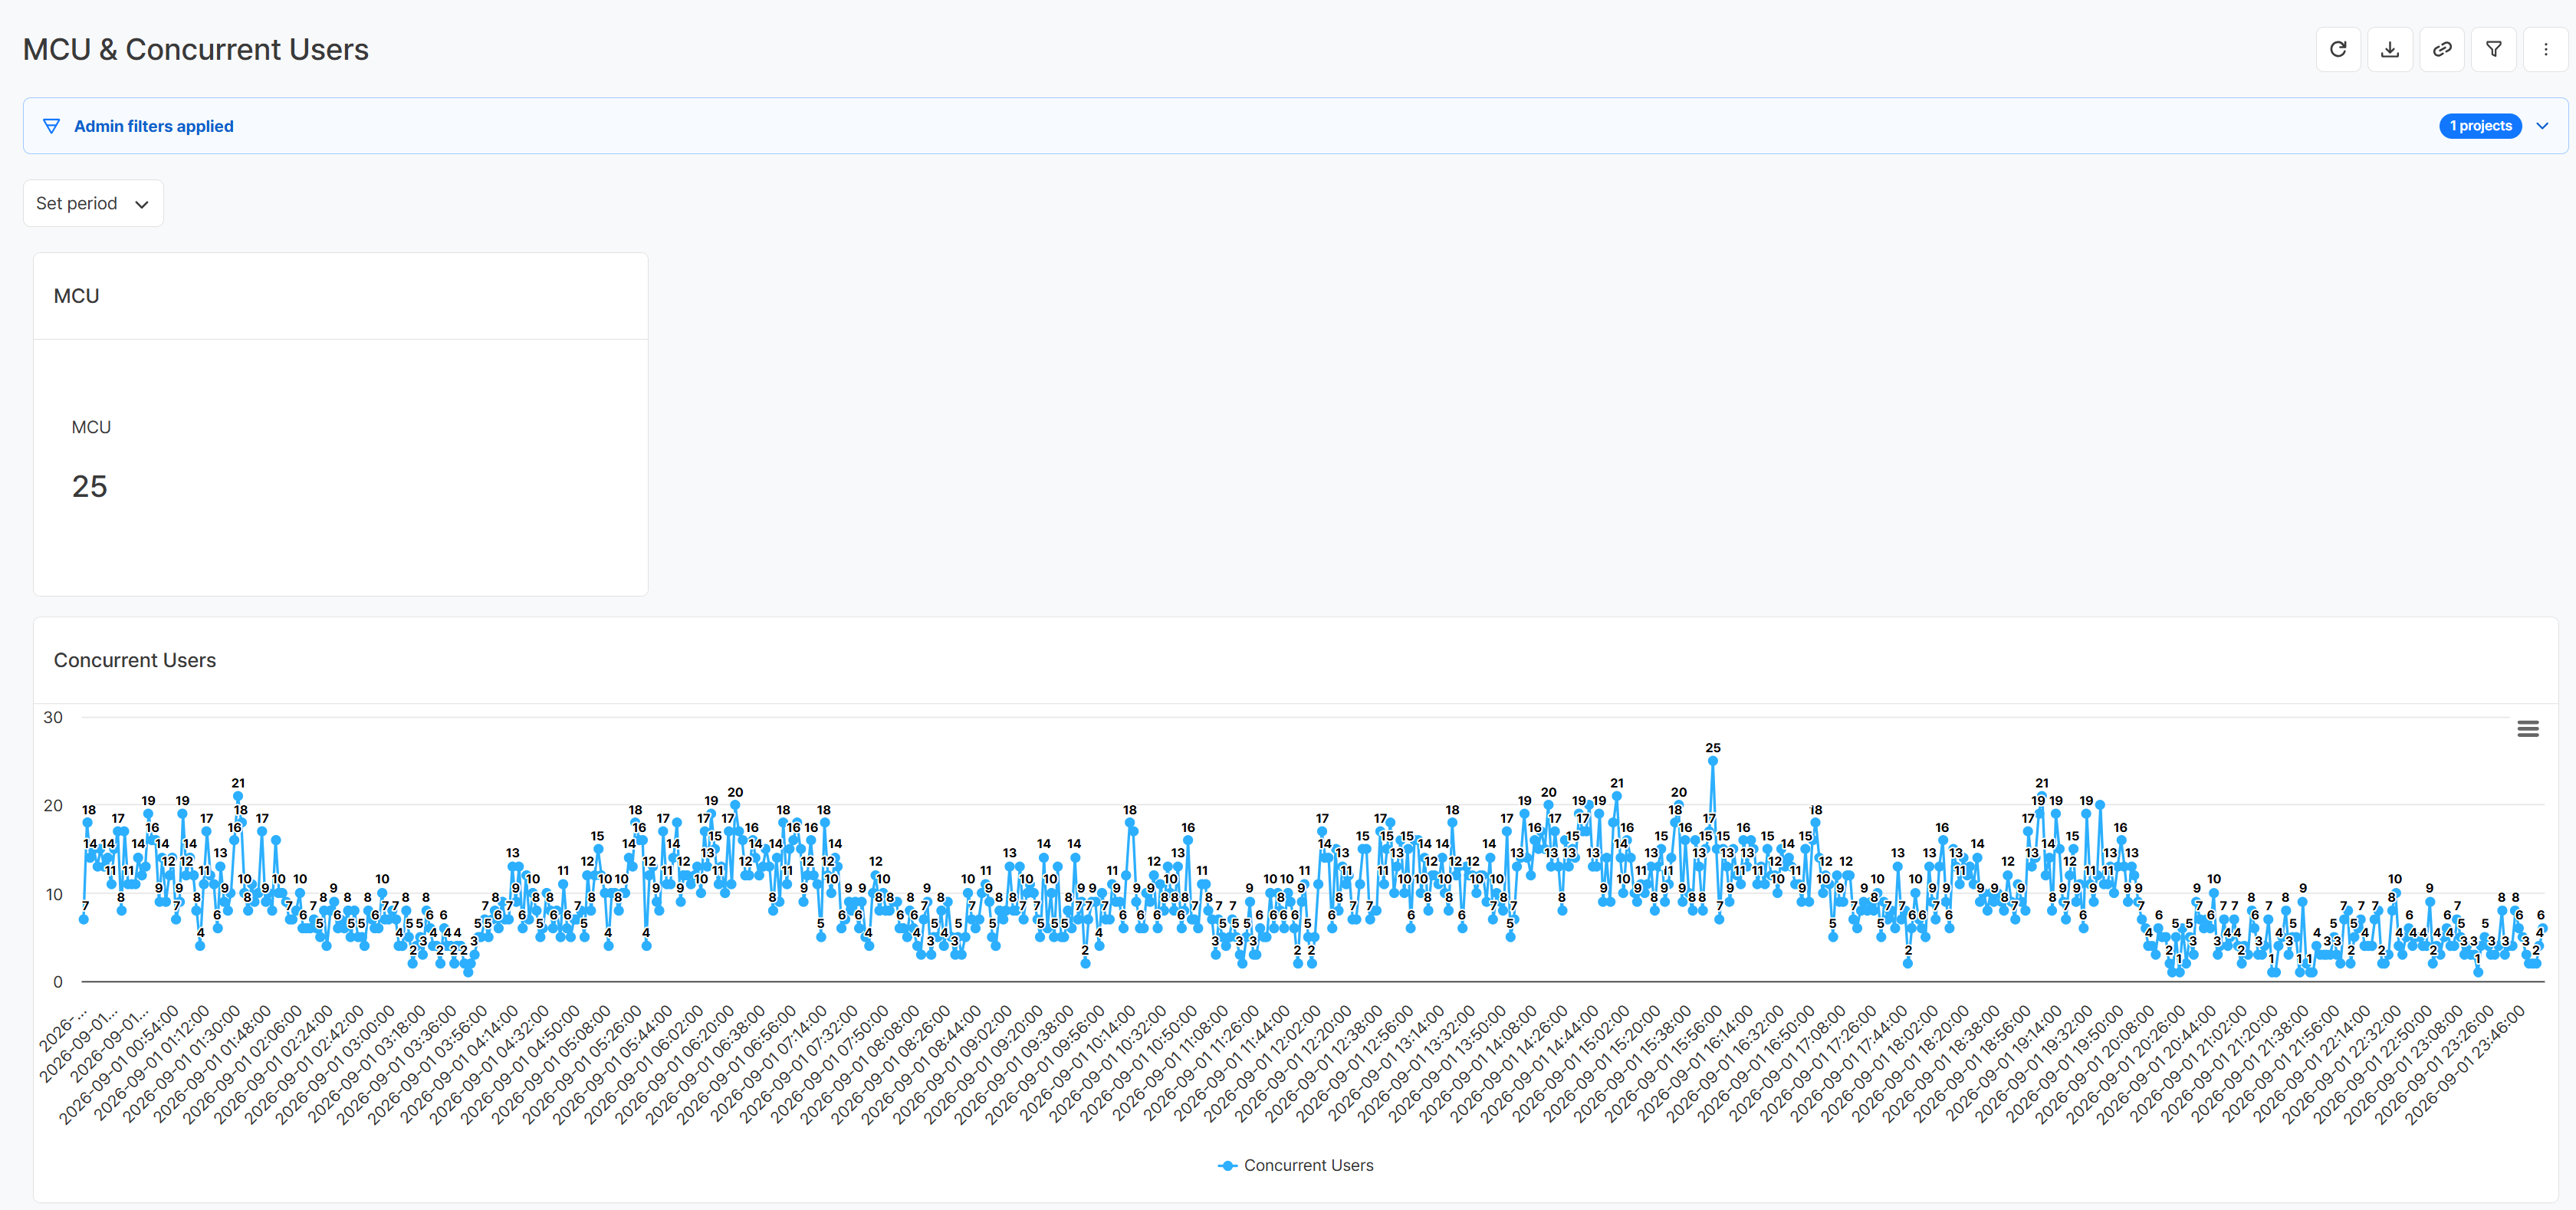
MAX to the 2-minute results shows today's peak concurrent users up to the time of the query.Placing both charts on a dashboard lets you see today's peak concurrent users up to the time of the query and the detailed 2-minute changes on one screen. Use the peak to understand the highest login scale so far, then look at the 2-minute chart to examine when the peak occurred and how logins flowed before and after it.
Getting Started with Hive Analytics
As shown above, you can apply a primary calculation to events and properties to build the measure you need, and use a secondary calculation to check the maximum, minimum, average, or latest value of the results at each time interval. This lets you look at detailed changes by time and the figures that represent a period together.
Hive Analytics is a game-focused analytics solution that lets you analyze game events collected through the Hive SDK in charts. Start applying primary and secondary calculations to your game events in Hive Analytics, and build charts with the metrics that fit your analysis.